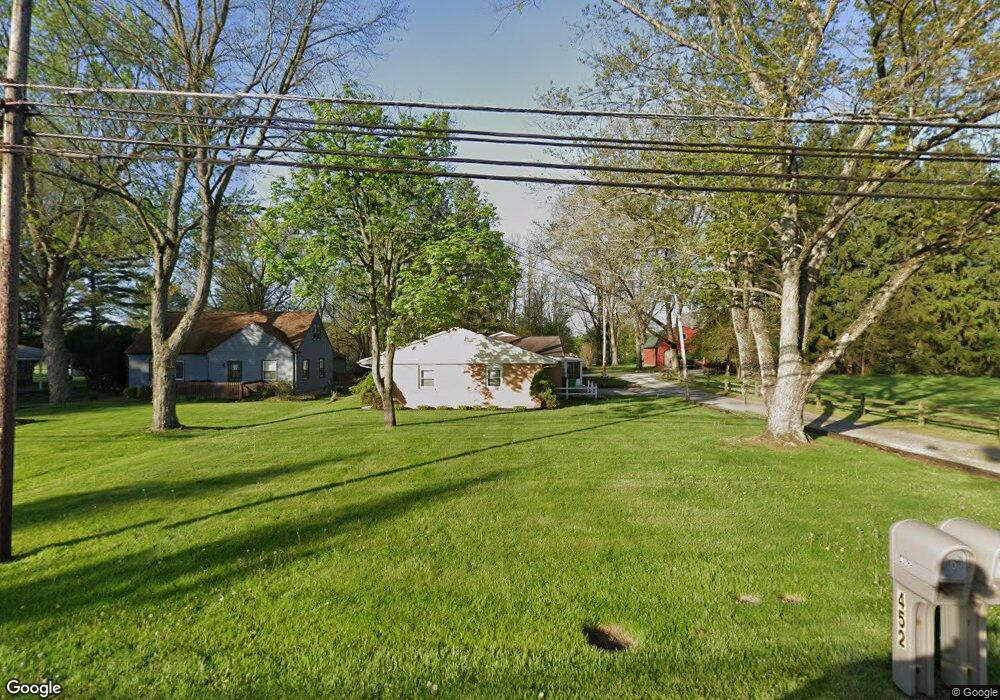
452 Southeast Ave Tallmadge, OH 44278
Estimated Value: $262,000 - $325,000
4
Beds
2
Baths
1,946
Sq Ft
$151/Sq Ft
Est. Value
About This Home
This home is located at 452 Southeast Ave, Tallmadge, OH 44278 and is currently estimated at $293,039, approximately $150 per square foot. 452 Southeast Ave is a home located in Summit County with nearby schools including Tallmadge Middle School, Tallmadge High School, and Steel Academy.
Ownership History
Date
Name
Owned For
Owner Type
Purchase Details
Closed on
Jul 20, 2018
Sold by
Ross Shirley J
Bought by
Keller Kevin W and Keller Teresia L
Current Estimated Value
Home Financials for this Owner
Home Financials are based on the most recent Mortgage that was taken out on this home.
Original Mortgage
$138,750
Outstanding Balance
$120,248
Interest Rate
4.5%
Mortgage Type
New Conventional
Estimated Equity
$172,791
Purchase Details
Closed on
Oct 12, 2012
Sold by
Ross Shirley J and Grace John E
Bought by
Ross Shirley J
Purchase Details
Closed on
Dec 6, 2006
Sold by
Ross Shirley J
Bought by
Ross Shirley J and Grace John E
Purchase Details
Closed on
Sep 1, 1994
Sold by
Wolfe Lowell I
Bought by
Ross Shirley J
Home Financials for this Owner
Home Financials are based on the most recent Mortgage that was taken out on this home.
Original Mortgage
$70,000
Interest Rate
8.59%
Mortgage Type
New Conventional
Create a Home Valuation Report for This Property
The Home Valuation Report is an in-depth analysis detailing your home's value as well as a comparison with similar homes in the area
Home Values in the Area
Average Home Value in this Area
Purchase History
| Date | Buyer | Sale Price | Title Company |
|---|---|---|---|
| Keller Kevin W | $185,000 | Kingdom Title | |
| Ross Shirley J | -- | None Available | |
| Ross Shirley J | -- | Attorney | |
| Ross Shirley J | $95,000 | -- |
Source: Public Records
Mortgage History
| Date | Status | Borrower | Loan Amount |
|---|---|---|---|
| Open | Keller Kevin W | $138,750 | |
| Previous Owner | Ross Shirley J | $70,000 |
Source: Public Records
Tax History Compared to Growth
Tax History
| Year | Tax Paid | Tax Assessment Tax Assessment Total Assessment is a certain percentage of the fair market value that is determined by local assessors to be the total taxable value of land and additions on the property. | Land | Improvement |
|---|---|---|---|---|
| 2025 | $4,110 | $81,554 | $10,749 | $70,805 |
| 2024 | $4,110 | $81,554 | $10,749 | $70,805 |
| 2023 | $4,110 | $81,554 | $10,749 | $70,805 |
| 2022 | $4,239 | $68,744 | $8,957 | $59,787 |
| 2021 | $4,258 | $68,744 | $8,957 | $59,787 |
| 2020 | $4,225 | $68,750 | $8,960 | $59,790 |
| 2019 | $3,813 | $55,480 | $7,340 | $48,140 |
| 2018 | $3,410 | $55,480 | $7,340 | $48,140 |
| 2017 | $3,201 | $55,480 | $7,340 | $48,140 |
| 2016 | $3,447 | $51,540 | $7,340 | $44,200 |
| 2015 | $3,201 | $51,540 | $7,340 | $44,200 |
| 2014 | $3,181 | $51,540 | $7,340 | $44,200 |
| 2013 | $2,569 | $51,650 | $7,340 | $44,310 |
Source: Public Records
Map
Nearby Homes
- 353 Southeast Ave
- 331 Southeast Ave
- 213 Green Hill Dr
- 130 Strecker Dr
- 500 Dottie Ct Unit 109
- 2333 Eastwood Ave
- 288 S Munroe Rd
- 786 Southeast Ave
- 2330 Eastwood Ave
- 185 Reserve Dr
- 689 Alaho St
- 243 S Munroe Rd
- 2354 Savoy Ave
- 523 S Munroe Rd
- 549 S Munroe Rd
- 758 Humble Rd
- 810 Norton Dr
- 464 Carruthers Rd
- 315 Fawnwood Dr
- 685 Beechview Dr
- 460 Southeast Ave
- 468 Southeast Ave
- 428 Southeast Ave
- 449 Southeast Ave
- 440 Southeast Ave
- 440 Southeast Ave
- 443 Southeast Ave
- 478 Southeast Ave
- 435 Southeast Ave
- 424 Southeast Ave
- 477 Southeast Ave
- 488 Southeast Ave
- 412 Southeast Ave
- 429 Southeast Ave
- 421 Southeast Ave
- 487 Southeast Ave
- 498 Southeast Ave
- 480 Green Field Cir
- 406 Southeast Ave
- 488 Green Field Cir