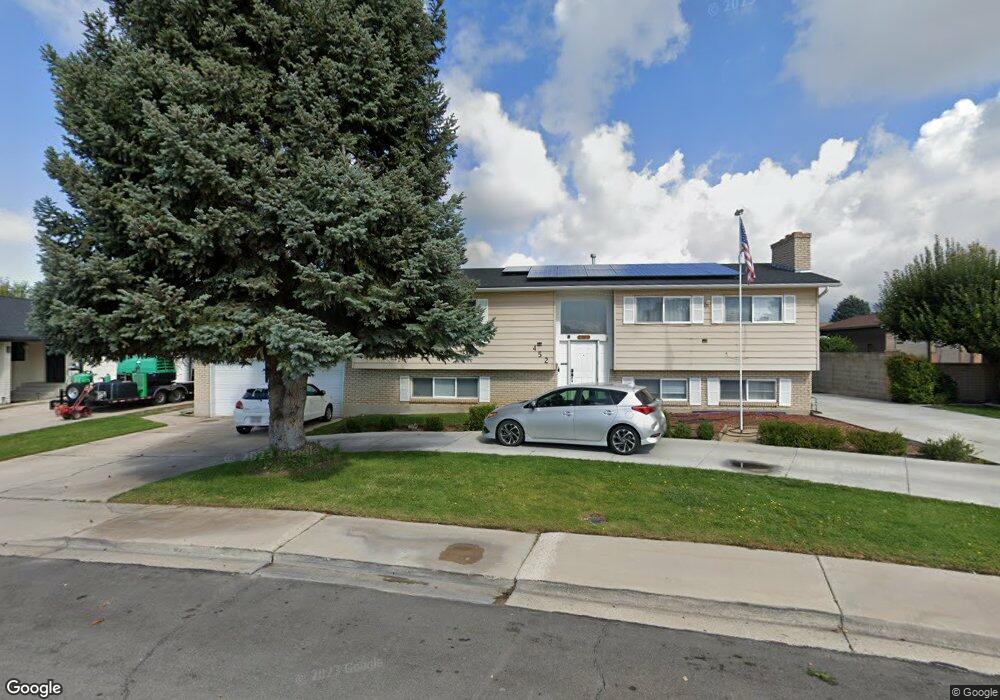
452 W 530 S Orem, UT 84058
Sunset Heights NeighborhoodEstimated Value: $556,000 - $613,000
5
Beds
3
Baths
2,788
Sq Ft
$207/Sq Ft
Est. Value
About This Home
This home is located at 452 W 530 S, Orem, UT 84058 and is currently estimated at $577,624, approximately $207 per square foot. 452 W 530 S is a home located in Utah County with nearby schools including Orem Elementary School, Lakeridge Jr High School, and Mountain View High School.
Ownership History
Date
Name
Owned For
Owner Type
Purchase Details
Closed on
Nov 10, 2023
Sold by
Acosta Maria Jesus A and Acosta Maria Cleofas
Bought by
Acosta Jesus A
Current Estimated Value
Purchase Details
Closed on
Dec 28, 2006
Sold by
Acosta Jesus A
Bought by
Acosta Jesus A and Acosta Maria Cleofas
Home Financials for this Owner
Home Financials are based on the most recent Mortgage that was taken out on this home.
Original Mortgage
$215,650
Interest Rate
7.69%
Mortgage Type
New Conventional
Purchase Details
Closed on
Aug 11, 2005
Sold by
Olsen Vefa Lunt
Bought by
Acosta Jesus A
Home Financials for this Owner
Home Financials are based on the most recent Mortgage that was taken out on this home.
Original Mortgage
$173,375
Interest Rate
8%
Mortgage Type
Purchase Money Mortgage
Create a Home Valuation Report for This Property
The Home Valuation Report is an in-depth analysis detailing your home's value as well as a comparison with similar homes in the area
Home Values in the Area
Average Home Value in this Area
Purchase History
We collect this data history from publicly available records. To have your information removed, we recommend requesting removal directly through your county’s website.
| Date | Buyer | Sale Price | Title Company |
|---|---|---|---|
| Acosta Jesus A | -- | None Listed On Document | |
| Acosta Jesus A | -- | Mountain West Title Company | |
| Acosta Jesus A | -- | Equity Title Tooele |
Source: Public Records
Mortgage History
We collect this data history from publicly available records. To have your information removed, we recommend requesting removal directly through your county’s website.
| Date | Status | Borrower | Loan Amount |
|---|---|---|---|
| Previous Owner | Acosta Jesus A | $215,650 | |
| Previous Owner | Acosta Jesus A | $173,375 |
Source: Public Records
Tax History
| Year | Tax Paid | Tax Assessment Tax Assessment Total Assessment is a certain percentage of the fair market value that is determined by local assessors to be the total taxable value of land and additions on the property. | Land | Improvement |
|---|---|---|---|---|
| 2025 | $2,271 | $286,495 | -- | -- |
| 2024 | $2,271 | $277,750 | $0 | $0 |
| 2023 | $2,132 | $280,170 | $0 | $0 |
| 2022 | $2,100 | $267,410 | $0 | $0 |
| 2021 | $1,955 | $377,100 | $178,100 | $199,000 |
| 2020 | $1,781 | $337,600 | $142,500 | $195,100 |
| 2019 | $1,595 | $314,300 | $131,500 | $182,800 |
| 2018 | $1,488 | $280,300 | $113,200 | $167,100 |
| 2017 | $1,376 | $138,765 | $0 | $0 |
| 2016 | $1,362 | $126,665 | $0 | $0 |
| 2015 | $1,345 | $118,305 | $0 | $0 |
| 2014 | $1,332 | $116,655 | $0 | $0 |
Source: Public Records
Map
Nearby Homes
Your Personal Tour Guide
Ask me questions while you tour the home.