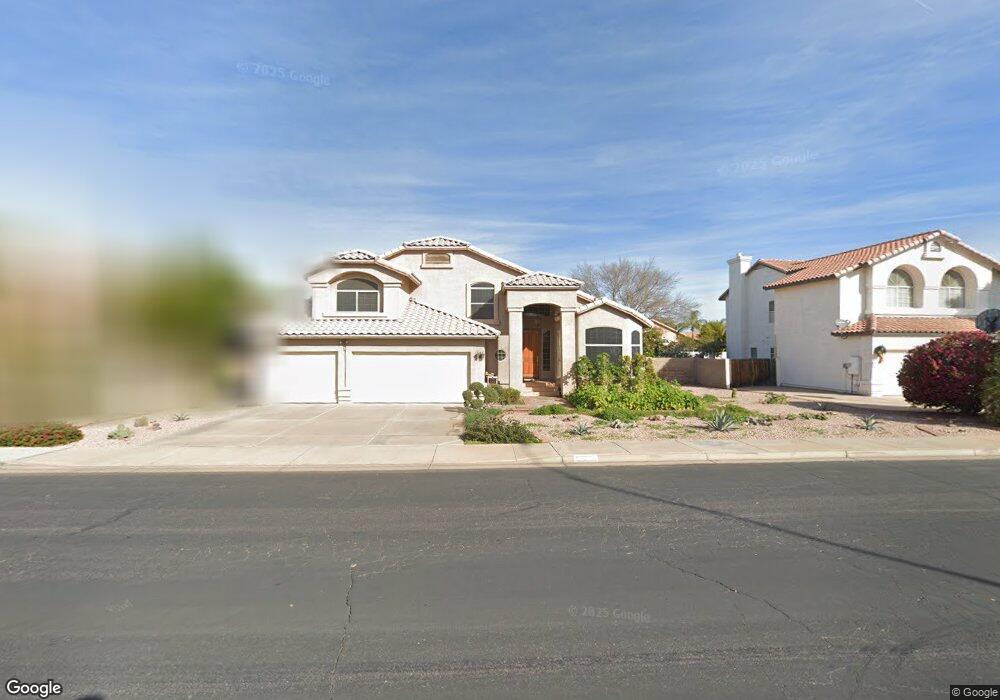
452 W Meseto Ave Mesa, AZ 85210
Dobson NeighborhoodEstimated Value: $636,410 - $711,000
--
Bed
4
Baths
3,082
Sq Ft
$218/Sq Ft
Est. Value
About This Home
This home is located at 452 W Meseto Ave, Mesa, AZ 85210 and is currently estimated at $671,353, approximately $217 per square foot. 452 W Meseto Ave is a home located in Maricopa County with nearby schools including Crismon Elementary School, Franklin at Brimhall Elementary School, and Franklin West Elementary School.
Ownership History
Date
Name
Owned For
Owner Type
Purchase Details
Closed on
Jan 29, 2015
Sold by
Chang Kwang Kyun
Bought by
The Ki Hong Chang & Soon N Chang Family
Current Estimated Value
Purchase Details
Closed on
Nov 12, 2012
Sold by
Chang Ki Hong and Chang Soon N
Bought by
Chang Kwang Kyun
Purchase Details
Closed on
Apr 27, 2005
Sold by
Chang Ki Hong and Chang Soon Nam
Bought by
Chang Ki Hong and Chang Soon Nam
Purchase Details
Closed on
Feb 22, 1995
Sold by
Continental Homes Inc
Bought by
Chang Ki Hong and Chang Soon Nam
Home Financials for this Owner
Home Financials are based on the most recent Mortgage that was taken out on this home.
Original Mortgage
$128,800
Interest Rate
9.23%
Mortgage Type
New Conventional
Purchase Details
Closed on
Oct 18, 1994
Sold by
Chi Construction Company
Bought by
Continental Homes Inc
Create a Home Valuation Report for This Property
The Home Valuation Report is an in-depth analysis detailing your home's value as well as a comparison with similar homes in the area
Home Values in the Area
Average Home Value in this Area
Purchase History
| Date | Buyer | Sale Price | Title Company |
|---|---|---|---|
| The Ki Hong Chang & Soon N Chang Family | -- | None Available | |
| Chang Kwang Kyun | -- | None Available | |
| Chang Ki Hong | -- | -- | |
| Chang Ki Hong | $171,761 | First American Title | |
| Continental Homes Inc | -- | First American Title |
Source: Public Records
Mortgage History
| Date | Status | Borrower | Loan Amount |
|---|---|---|---|
| Closed | Chang Ki Hong | $128,800 |
Source: Public Records
Tax History Compared to Growth
Tax History
| Year | Tax Paid | Tax Assessment Tax Assessment Total Assessment is a certain percentage of the fair market value that is determined by local assessors to be the total taxable value of land and additions on the property. | Land | Improvement |
|---|---|---|---|---|
| 2025 | $2,800 | $33,714 | -- | -- |
| 2024 | $2,830 | $32,109 | -- | -- |
| 2023 | $2,830 | $51,510 | $10,300 | $41,210 |
| 2022 | $2,768 | $38,610 | $7,720 | $30,890 |
| 2021 | $2,844 | $36,380 | $7,270 | $29,110 |
| 2020 | $2,806 | $33,960 | $6,790 | $27,170 |
| 2019 | $2,600 | $32,860 | $6,570 | $26,290 |
| 2018 | $2,482 | $31,960 | $6,390 | $25,570 |
| 2017 | $2,404 | $30,400 | $6,080 | $24,320 |
| 2016 | $2,361 | $31,760 | $6,350 | $25,410 |
| 2015 | $2,229 | $27,670 | $5,530 | $22,140 |
Source: Public Records
Map
Nearby Homes
- 416 W Nido Cir
- 629 W Navarro Ave
- 643 W Medina Ave
- 653 W Guadalupe Rd Unit 2005
- 653 W Guadalupe Rd Unit 2019
- 623 W Guadalupe Rd Unit 214
- 623 W Guadalupe Rd Unit 171
- 623 W Guadalupe Rd Unit 254
- 533 W Guadalupe Rd Unit 1122
- 533 W Guadalupe Rd Unit 2032
- 533 W Guadalupe Rd Unit 1001
- 563 W Kilarea Ave
- 508 W Pampa Ave
- 922 W Monte Ave
- 945 W Mendoza Ave
- 2834 S Extension Rd Unit 1031
- 537 W Posada Ave
- 3011 S Extension Rd
- 1005 W Madero Ave
- 906 W Kiowa Ave
- 444 W Meseto Ave
- 460 W Meseto Ave
- 439 W Monterey Ave
- 433 W Monterey Ave
- 445 W Monterey Ave
- 2516 S Colleen Cir
- 506 W Meseto Ave
- 2541 S Orange
- 2542 S Vineyard
- 451 W Monterey Ave
- 2524 S Colleen Cir
- 505 W Meseto Ave
- 2548 S Vineyard
- 2554 S Colleen Cir
- 2547 S Orange
- 514 W Meseto Ave
- 432 W Monte Cir
- 457 W Monterey Ave
- 444 W Monterey Ave
- 438 W Monterey Ave