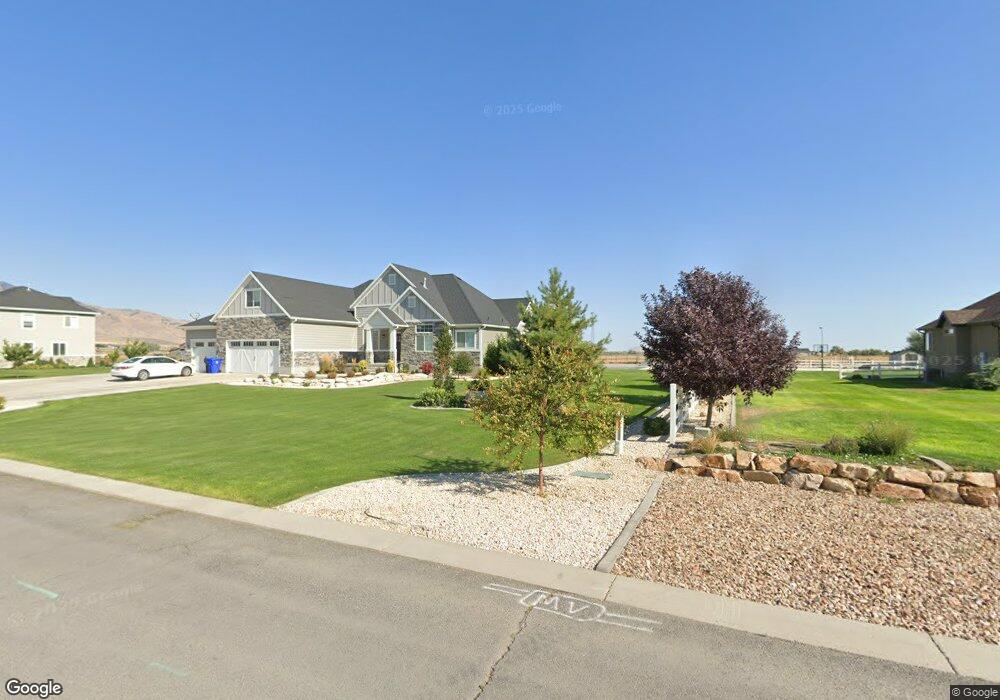
452 W Wrathall Ln Grantsville, UT 84029
Estimated Value: $586,000 - $812,000
3
Beds
2
Baths
4,800
Sq Ft
$149/Sq Ft
Est. Value
About This Home
This home is located at 452 W Wrathall Ln, Grantsville, UT 84029 and is currently estimated at $717,499, approximately $149 per square foot. 452 W Wrathall Ln is a home located in Tooele County with nearby schools including Grantsville Elementary School, Grantsville Junior High School, and Grantsville High School.
Ownership History
Date
Name
Owned For
Owner Type
Purchase Details
Closed on
Jun 23, 2010
Sold by
Cooper Joshua H and Cooper Ashlee
Bought by
Alverson John J and Alverson Brenda R
Current Estimated Value
Home Financials for this Owner
Home Financials are based on the most recent Mortgage that was taken out on this home.
Original Mortgage
$230,000
Outstanding Balance
$153,008
Interest Rate
4.82%
Mortgage Type
New Conventional
Estimated Equity
$564,491
Purchase Details
Closed on
Feb 12, 2009
Sold by
Cooper Joshua H
Bought by
Cooper Joshua H and Cooper Ashlee
Home Financials for this Owner
Home Financials are based on the most recent Mortgage that was taken out on this home.
Original Mortgage
$325,600
Interest Rate
5.01%
Mortgage Type
FHA
Purchase Details
Closed on
Feb 11, 2009
Sold by
Johnson J Michael and Johnson Sheri
Bought by
Cooper Joshua H
Home Financials for this Owner
Home Financials are based on the most recent Mortgage that was taken out on this home.
Original Mortgage
$325,600
Interest Rate
5.01%
Mortgage Type
FHA
Create a Home Valuation Report for This Property
The Home Valuation Report is an in-depth analysis detailing your home's value as well as a comparison with similar homes in the area
Home Values in the Area
Average Home Value in this Area
Purchase History
| Date | Buyer | Sale Price | Title Company |
|---|---|---|---|
| Alverson John J | -- | Security Title Ins | |
| Cooper Joshua H | -- | Equity Title | |
| Cooper Joshua H | -- | Equity Title |
Source: Public Records
Mortgage History
| Date | Status | Borrower | Loan Amount |
|---|---|---|---|
| Open | Alverson John J | $230,000 | |
| Previous Owner | Cooper Joshua H | $325,600 |
Source: Public Records
Tax History Compared to Growth
Tax History
| Year | Tax Paid | Tax Assessment Tax Assessment Total Assessment is a certain percentage of the fair market value that is determined by local assessors to be the total taxable value of land and additions on the property. | Land | Improvement |
|---|---|---|---|---|
| 2025 | $5,285 | $467,644 | $110,300 | $357,344 |
| 2024 | $5,285 | $431,524 | $110,300 | $321,224 |
| 2023 | $5,285 | $412,042 | $93,800 | $318,242 |
| 2022 | $4,457 | $410,182 | $124,050 | $286,132 |
| 2021 | $4,507 | $338,301 | $69,050 | $269,251 |
| 2020 | $3,712 | $467,936 | $125,300 | $342,636 |
| 2019 | $3,495 | $425,844 | $75,200 | $350,644 |
| 2018 | $3,470 | $396,757 | $75,200 | $321,557 |
| 2017 | $3,068 | $370,314 | $75,200 | $295,114 |
| 2016 | $2,959 | $204,351 | $41,450 | $162,901 |
| 2015 | $2,959 | $204,351 | $0 | $0 |
| 2014 | -- | $188,124 | $0 | $0 |
Source: Public Records
Map
Nearby Homes
- 340 W Wrathall Ln
- 356 N Wrathall Cir
- 327 N 600 W
- 497 Old Lincoln Hwy
- 500 W Clark St
- 600 W Clark St
- 841 N Hale St Unit 1
- 727 W Island Vista Cir
- 407 W Richard St
- 49 Tiebreaker Cir
- 39 N Wayne Way
- 26 N Wayne Way
- 37 N Wayne Way
- 643 W Banner Dr
- 653 W Banner Dr
- 655 W Banner Dr Unit 1042
- 88 N Maraschino Ln
- 93 S Maraschino Ln
- 765 W Vista View Dr
- 28 Meadowlark Cir
- 438 W Wrathall Ln Unit 4
- 458 W Wrathall Ln
- 449 W Wrathall Ln
- 424 W Wrathall Ln
- 457 W Wrathall Ln
- 457 W Wrathall Ln
- 431 W Wrathall Ln Unit 9
- 410 W Wrathall Ln
- 417 W Wrathall Ln Unit 10
- 417 W Wrathall Ln Unit 10
- 396 W Wrathall Ln
- 396 W Wrathall Ln Unit 1
- 397 W Wrathall Ln
- 581 Warr St Unit 4
- 508 Warr St
- 374 W Wrathall Ln
- 526 Warr St
- 375 W Wrathall Ln
- 542 Warr St
- 354 W Wrathall Ln