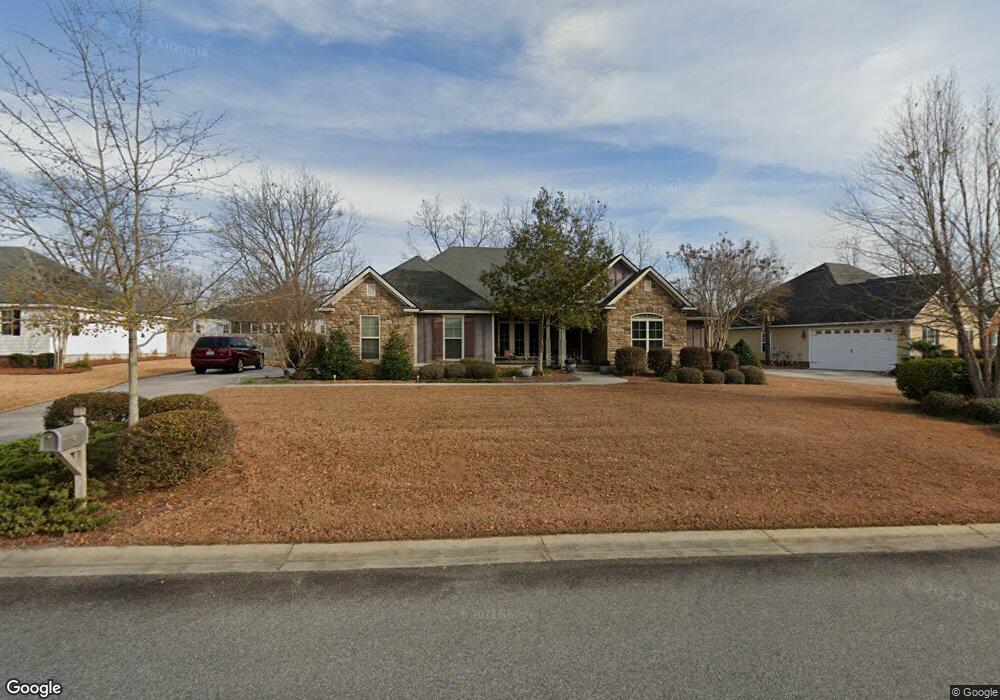
4520 San Saba Dr Hahira, GA 31632
Estimated Value: $399,000 - $493,000
4
Beds
3
Baths
2,450
Sq Ft
$175/Sq Ft
Est. Value
About This Home
This home is located at 4520 San Saba Dr, Hahira, GA 31632 and is currently estimated at $429,654, approximately $175 per square foot. 4520 San Saba Dr is a home located in Lowndes County with nearby schools including Westside Elementary School, Hahira Middle School, and Lowndes High School.
Ownership History
Date
Name
Owned For
Owner Type
Purchase Details
Closed on
Oct 22, 2013
Sold by
Copeland Nicholas S
Bought by
Brewton R Gerald and Wanda Brewton B
Current Estimated Value
Home Financials for this Owner
Home Financials are based on the most recent Mortgage that was taken out on this home.
Original Mortgage
$100,000
Interest Rate
4.33%
Mortgage Type
New Conventional
Purchase Details
Closed on
Jun 25, 2010
Sold by
Franklin Bailey Construction Llc
Bought by
Copeland Nicholas S and Copeland Kami D
Home Financials for this Owner
Home Financials are based on the most recent Mortgage that was taken out on this home.
Original Mortgage
$257,926
Interest Rate
3.25%
Mortgage Type
FHA
Purchase Details
Closed on
Jun 7, 2007
Sold by
Homes By Bailey Inc
Bought by
Franklin Bailey Construction L
Purchase Details
Closed on
Feb 16, 2007
Sold by
Grove Pointe Llc
Bought by
Homes By Bailey Inc
Purchase Details
Closed on
Feb 28, 2006
Sold by
Dasher Howard Comp Inc
Bought by
Grove Pointe Llc
Create a Home Valuation Report for This Property
The Home Valuation Report is an in-depth analysis detailing your home's value as well as a comparison with similar homes in the area
Home Values in the Area
Average Home Value in this Area
Purchase History
| Date | Buyer | Sale Price | Title Company |
|---|---|---|---|
| Brewton R Gerald | $273,000 | -- | |
| Copeland Nicholas S | $261,400 | -- | |
| Franklin Bailey Construction L | -- | -- | |
| Homes By Bailey Inc | $368,000 | -- | |
| Grove Pointe Llc | $7,094,300 | -- |
Source: Public Records
Mortgage History
| Date | Status | Borrower | Loan Amount |
|---|---|---|---|
| Closed | Brewton R Gerald | $100,000 | |
| Previous Owner | Copeland Nicholas S | $257,926 |
Source: Public Records
Tax History Compared to Growth
Tax History
| Year | Tax Paid | Tax Assessment Tax Assessment Total Assessment is a certain percentage of the fair market value that is determined by local assessors to be the total taxable value of land and additions on the property. | Land | Improvement |
|---|---|---|---|---|
| 2024 | $3,132 | $138,727 | $24,000 | $114,727 |
| 2023 | $3,132 | $134,727 | $20,000 | $114,727 |
| 2022 | $3,114 | $119,484 | $20,000 | $99,484 |
| 2021 | $2,782 | $103,438 | $20,000 | $83,438 |
| 2020 | $2,588 | $103,438 | $20,000 | $83,438 |
| 2019 | $2,283 | $91,304 | $19,200 | $72,104 |
| 2018 | $2,306 | $91,304 | $19,200 | $72,104 |
| 2017 | $2,335 | $91,304 | $19,200 | $72,104 |
| 2016 | $2,496 | $96,816 | $19,200 | $77,616 |
| 2015 | -- | $96,816 | $19,200 | $77,616 |
| 2014 | $2,717 | $96,816 | $19,200 | $77,616 |
Source: Public Records
Map
Nearby Homes
- 0 Dasher Grove Rd
- 5263 Maycomb Ave
- 5372 Myrick Cir
- 4773 Pawnee Dr
- 5379 Maycomb Ave
- 5229 Maycomb Ave
- 5047 Planters Crossing
- 4735 Layla Ln
- 5078 Planters Crossing
- 5020 Hatfield Cir
- 4609 Amelia Cir
- 4809 Brown Cat Cir
- 5039 Hatfield Cir
- 3041 Houser Way
- 5051 Hatfield Cir
- 5055 Hatfield Cir
- 5211 Abbott Cir
- 3061 Houser Way
- 4029 Ashbourne Dr
- 4868 Brown Cat Cir
- 4516 San Saba Dr
- 4507 Kiowa Ln
- 4501 Kiowa Ln
- 4513 Kiowa Ln
- 4530 San Saba Dr
- 4521 San Saba Dr
- 4523 San Saba Dr
- 4495 Kiowa Ln
- 4519 Kiowa Ln
- 0 Kiowa Ln Unit 68695
- 0 Kiowa Ln Unit 8181674
- 4517 San Saba Dr
- 4513 San Saba Dr
- 4529 San Saba Dr
- 4525 Kiowa Ln
- 4489 Kiowa Ln
- 4538 San Saba Dr
- 4543 Courtland Cir
- 4509 San Saba Dr
- 4506 Kiowa Ln