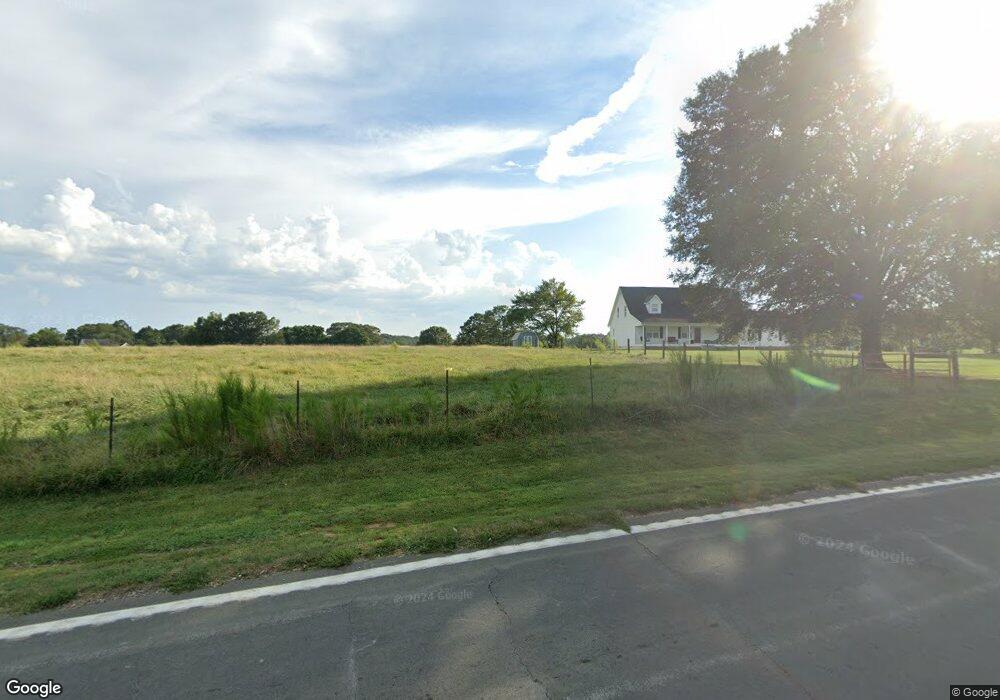
4520 Sandy Cross Rd Royston, GA 30662
Estimated Value: $408,000 - $842,131
3
Beds
3
Baths
2,009
Sq Ft
$335/Sq Ft
Est. Value
About This Home
This home is located at 4520 Sandy Cross Rd, Royston, GA 30662 and is currently estimated at $672,710, approximately $334 per square foot. 4520 Sandy Cross Rd is a home located in Franklin County with nearby schools including Franklin County High School.
Ownership History
Date
Name
Owned For
Owner Type
Purchase Details
Closed on
Dec 16, 2021
Sold by
Phillips John M
Bought by
Phillips Caleb Lance
Current Estimated Value
Purchase Details
Closed on
Sep 15, 2020
Sold by
Phillips John M
Bought by
Westbrook Kyle B and Westbrook Melanie Cape
Purchase Details
Closed on
Jan 6, 2006
Sold by
Bell James
Bought by
Phillips John M and Phillips Sandy Y
Purchase Details
Closed on
Jun 21, 2004
Sold by
Phillips Dwight A
Bought by
Phillips John M
Create a Home Valuation Report for This Property
The Home Valuation Report is an in-depth analysis detailing your home's value as well as a comparison with similar homes in the area
Purchase History
| Date | Buyer | Sale Price | Title Company |
|---|---|---|---|
| Phillips Caleb Lance | -- | -- | |
| Westbrook Kyle B | $85,000 | -- | |
| Phillips John M | $1,410 | -- | |
| Phillips John M | -- | -- |
Source: Public Records
Tax History
| Year | Tax Paid | Tax Assessment Tax Assessment Total Assessment is a certain percentage of the fair market value that is determined by local assessors to be the total taxable value of land and additions on the property. | Land | Improvement |
|---|---|---|---|---|
| 2025 | $3,903 | $288,318 | $137,524 | $150,794 |
| 2024 | $4,102 | $247,979 | $92,834 | $155,145 |
| 2023 | $4,094 | $233,103 | $91,069 | $142,034 |
| 2022 | $3,760 | $200,753 | $70,663 | $130,090 |
| 2021 | $4,227 | $214,130 | $75,372 | $138,758 |
| 2020 | $4,322 | $205,348 | $70,988 | $134,360 |
| 2019 | $4,158 | $205,350 | $70,989 | $134,361 |
| 2018 | $3,650 | $201,361 | $85,268 | $116,093 |
| 2017 | $3,778 | $201,361 | $85,268 | $116,093 |
Source: Public Records
Map
Nearby Homes
- 4308 Athens Rd
- 0 Nails Creek Crossing Unit 7703368
- 0 Nails Creek Crossing Unit 10708667
- 1291 Brays Lake Rd
- 533 Pearwood Rd
- 31 Dons Ct
- 41 Manley Terrace
- 6050 Sandy Cross Rd
- 714 Nails Creek Crossing
- 8065 Sandy Cross Rd
- 156 Neal Little Rd
- 1898 Sandy Cross Rd
- 0 Noah Crow Rd Unit 10711924
- 0 Noah Crow Rd Unit 10711957
- 0 Noah Crow Rd Unit 10692629
- 5177 Sandy Cross Rd
- 7660 Sandy Cross Rd
- 318 Jim Grizzle Rd
- 222 Reno Rd
- 352 Jim Grizzle Rd
- 4294 Sandy Cross Rd
- 4300 Sandy Cross Rd
- 4378 Sandy Cross Rd
- 4210 Sandy Cross Rd
- 4297 Sandy Cross Rd
- 4225 Sandy Cross Rd
- 1607 Cromers Bridge Rd
- 292 Corner Bridge Ln
- 292 Cromers Bridge Ln
- 690 County Road 178
- 291 Cromers Bridge Ln
- 4140 Sandy Cross Rd
- 1732 Cromers Bridge Rd
- 1545 Cromers Bridge Rd
- 1584 Cromers Bridge Rd
- 265 Cromers Bridge Ln
- 1459 Cromers Bridge Rd
- 1480 Cromer's Bridge Rd
- 1480 Cromers Bridge Rd
- 4071 Sandy Cross Rd
Your Personal Tour Guide
Ask me questions while you tour the home.