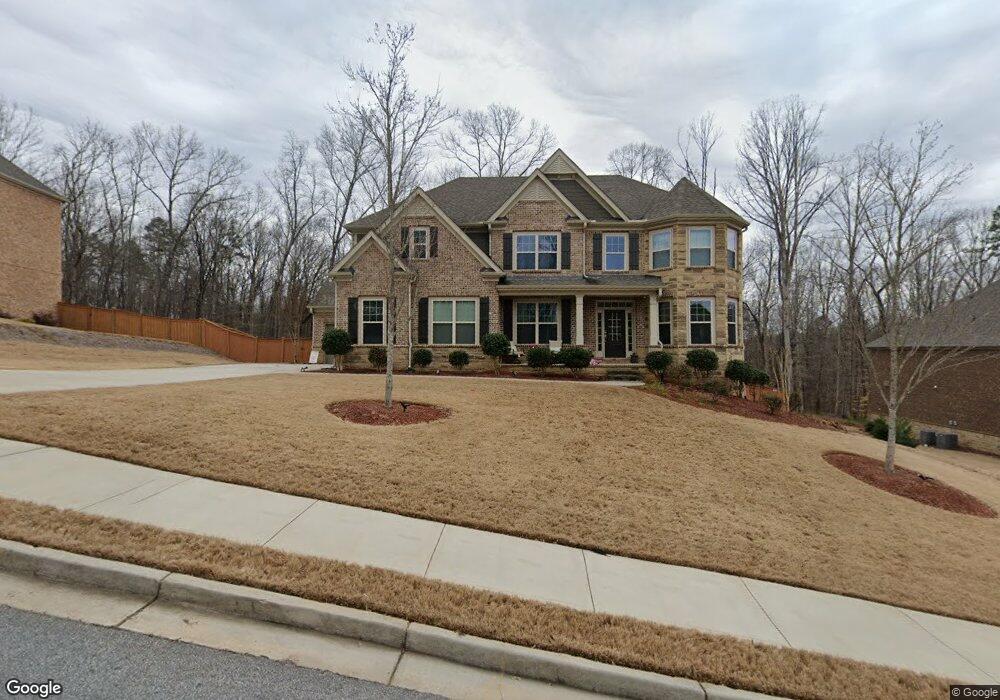
4520 Sterling Pointe Dr NW Unit 41 Kennesaw, GA 30152
Estimated Value: $855,000 - $933,000
5
Beds
4
Baths
4,417
Sq Ft
$203/Sq Ft
Est. Value
About This Home
This home is located at 4520 Sterling Pointe Dr NW Unit 41, Kennesaw, GA 30152 and is currently estimated at $894,743, approximately $202 per square foot. 4520 Sterling Pointe Dr NW Unit 41 is a home located in Cobb County with nearby schools including Frey Elementary School, Mcclure Middle School, and Allatoona High School.
Ownership History
Date
Name
Owned For
Owner Type
Purchase Details
Closed on
Nov 24, 2020
Sold by
Lomax Valerie M and Daniels Valerie
Bought by
Daniels Valerie
Current Estimated Value
Home Financials for this Owner
Home Financials are based on the most recent Mortgage that was taken out on this home.
Original Mortgage
$456,692
Outstanding Balance
$407,317
Interest Rate
2.8%
Mortgage Type
New Conventional
Estimated Equity
$487,426
Purchase Details
Closed on
May 29, 2019
Sold by
Lomax Adkin D
Bought by
Lomax Valerie M
Purchase Details
Closed on
Apr 29, 2016
Sold by
Lennar Georgia Inc
Bought by
Lomax Adkin D and Lomax Valerie M
Home Financials for this Owner
Home Financials are based on the most recent Mortgage that was taken out on this home.
Original Mortgage
$482,638
Interest Rate
3.71%
Mortgage Type
VA
Purchase Details
Closed on
Oct 23, 2015
Sold by
Cl Westpark Llc
Bought by
Lennar Georgia Inc
Create a Home Valuation Report for This Property
The Home Valuation Report is an in-depth analysis detailing your home's value as well as a comparison with similar homes in the area
Home Values in the Area
Average Home Value in this Area
Purchase History
| Date | Buyer | Sale Price | Title Company |
|---|---|---|---|
| Daniels Valerie | -- | None Available | |
| Daniels Valerie | -- | None Listed On Document | |
| Lomax Valerie M | -- | -- | |
| Lomax Adkin D | $483,960 | -- | |
| Lennar Georgia Inc | $160,000 | -- |
Source: Public Records
Mortgage History
| Date | Status | Borrower | Loan Amount |
|---|---|---|---|
| Open | Daniels Valerie | $456,692 | |
| Closed | Daniels Valerie | $456,692 | |
| Previous Owner | Lomax Adkin D | $482,638 |
Source: Public Records
Tax History Compared to Growth
Tax History
| Year | Tax Paid | Tax Assessment Tax Assessment Total Assessment is a certain percentage of the fair market value that is determined by local assessors to be the total taxable value of land and additions on the property. | Land | Improvement |
|---|---|---|---|---|
| 2024 | $8,137 | $313,964 | $40,000 | $273,964 |
| 2023 | $7,594 | $313,964 | $40,000 | $273,964 |
| 2022 | $5,639 | $197,068 | $40,000 | $157,068 |
| 2021 | $5,639 | $197,068 | $40,000 | $157,068 |
| 2020 | $5,639 | $197,068 | $40,000 | $157,068 |
| 2019 | $3,396 | $200,828 | $40,000 | $160,828 |
| 2018 | $5,462 | $188,988 | $40,000 | $148,988 |
| 2017 | $5,433 | $188,988 | $40,000 | $148,988 |
| 2016 | $920 | $32,000 | $32,000 | $0 |
| 2015 | $943 | $32,000 | $32,000 | $0 |
Source: Public Records
Map
Nearby Homes
- 4467 Sterling Pointe Dr NW
- 4525 Cavallon Way NW
- 4902 Pleasantry Way NW
- 2108 Walnut Creek Trail NW
- 4973 Newpark Ln NW
- 4980 Newpark Ln NW Unit 2
- 4544 Cavallon Way NW
- 5087 Dillingham Dr NW
- 4980 Pleasantry Way NW
- 5105 Dillingham Dr NW
- 2295 Inverwood Dr NW
- 1812 Mountain Lake Dr NW
- 5090 Newpark Dr NW
- 5153 Elkins Ln NW
- 5116 Barton Pass NW
- 4547 Meadow Green Ln NW
- 1591 Petal Point NW Unit 2
- 4520 Sterling Pointe Dr NW
- 4514 Sterling Pointe Dr NW Unit 42
- 4514 Sterling Pointe Dr NW Unit 20
- 4514 Sterling Pointe Dr NW
- 4526 Sterling Pointe Dr Unit 40
- 4526 Sterling Pointe Dr
- 4526 Sterling Pointe Dr NW
- 4526 Sterling Pointe Dr NW Unit 40
- 4523 Sterling Pointe Dr NW Unit 21
- 4523 Sterling Pointe Dr NW
- 4508 Sterling Pointe Dr NW Unit 3
- 4508 Sterling Pointe Dr NW Unit 43
- 4508 Sterling Pointe Dr NW
- 4529 Sterling Pointe Dr NW
- 4532 Sterling Pointe Dr NW Unit 39
- 4532 Sterling Pointe Dr NW
- 4517 Sterling Pointe Dr NW Unit 20
- 4517 Sterling Pointe Dr NW
- 4535 Sterling Pointe Dr NW
- 1955 Palladium Dr NW Unit 44