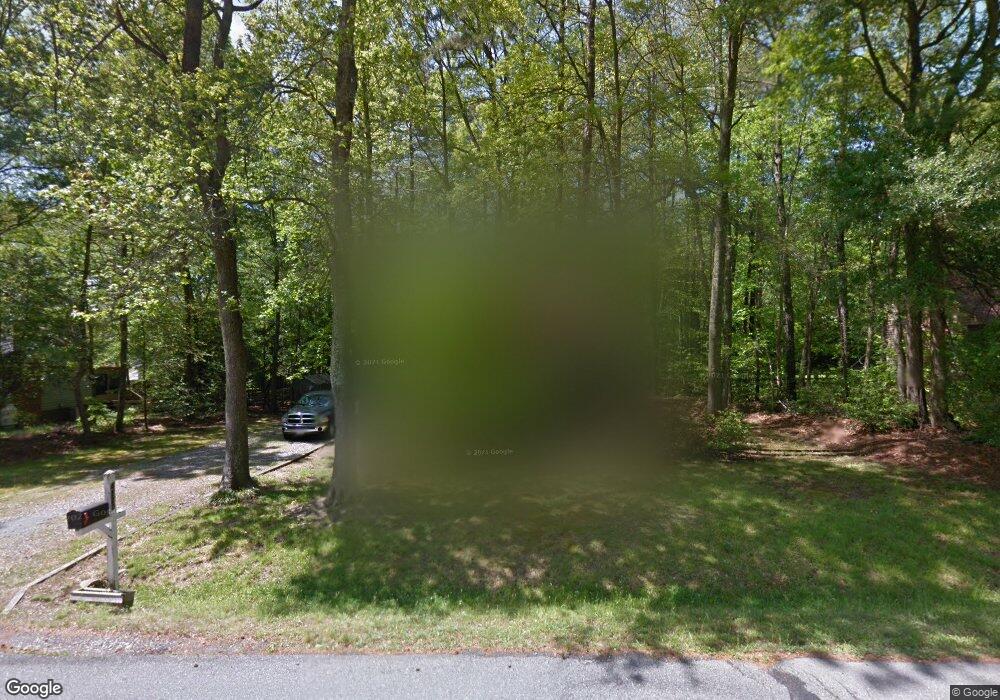
4520 Stigall Dr Midlothian, VA 23112
Estimated Value: $295,000 - $318,000
3
Beds
1
Bath
1,052
Sq Ft
$295/Sq Ft
Est. Value
About This Home
This home is located at 4520 Stigall Dr, Midlothian, VA 23112 and is currently estimated at $309,997, approximately $294 per square foot. 4520 Stigall Dr is a home located in Chesterfield County with nearby schools including Thelma Crenshaw Elementary School, Bailey Bridge Middle School, and Manchester High.
Ownership History
Date
Name
Owned For
Owner Type
Purchase Details
Closed on
Jun 12, 2012
Sold by
Duke Robert B
Bought by
Duke Robet B
Current Estimated Value
Home Financials for this Owner
Home Financials are based on the most recent Mortgage that was taken out on this home.
Original Mortgage
$160,280
Outstanding Balance
$103,915
Interest Rate
2.5%
Mortgage Type
VA
Estimated Equity
$206,082
Purchase Details
Closed on
Dec 5, 2006
Sold by
Parrish Timothy
Bought by
Duke Robert
Home Financials for this Owner
Home Financials are based on the most recent Mortgage that was taken out on this home.
Original Mortgage
$162,009
Interest Rate
6.31%
Mortgage Type
VA
Purchase Details
Closed on
Oct 16, 1997
Sold by
Parrish Timothy M
Bought by
Parrish Timothy M
Home Financials for this Owner
Home Financials are based on the most recent Mortgage that was taken out on this home.
Original Mortgage
$58,000
Interest Rate
7.46%
Mortgage Type
New Conventional
Create a Home Valuation Report for This Property
The Home Valuation Report is an in-depth analysis detailing your home's value as well as a comparison with similar homes in the area
Home Values in the Area
Average Home Value in this Area
Purchase History
| Date | Buyer | Sale Price | Title Company |
|---|---|---|---|
| Duke Robet B | -- | National Title Ntwk Inc | |
| Duke Robert | $158,600 | -- | |
| Parrish Timothy M | -- | -- |
Source: Public Records
Mortgage History
| Date | Status | Borrower | Loan Amount |
|---|---|---|---|
| Open | Duke Robet B | $160,280 | |
| Previous Owner | Duke Robert | $162,009 | |
| Previous Owner | Parrish Timothy M | $58,000 |
Source: Public Records
Tax History
| Year | Tax Paid | Tax Assessment Tax Assessment Total Assessment is a certain percentage of the fair market value that is determined by local assessors to be the total taxable value of land and additions on the property. | Land | Improvement |
|---|---|---|---|---|
| 2025 | $2,349 | $261,100 | $60,000 | $201,100 |
| 2024 | $2,349 | $259,000 | $53,000 | $206,000 |
| 2023 | $2,356 | $244,200 | $51,000 | $193,200 |
| 2022 | $2,112 | $229,600 | $48,000 | $181,600 |
| 2021 | $1,994 | $202,900 | $45,000 | $157,900 |
| 2020 | $1,694 | $178,300 | $45,000 | $133,300 |
| 2019 | $1,617 | $170,200 | $44,000 | $126,200 |
| 2018 | $1,466 | $154,300 | $42,000 | $112,300 |
| 2017 | $1,443 | $150,300 | $42,000 | $108,300 |
| 2016 | $1,362 | $141,900 | $42,000 | $99,900 |
| 2015 | $1,371 | $140,200 | $42,000 | $98,200 |
| 2014 | $1,291 | $131,900 | $42,000 | $89,900 |
Source: Public Records
Map
Nearby Homes
- 4507 Parrish Branch Rd
- 11431 Brandenburg Dr
- 11531 Bailey Woods Dr
- 11718 Bailey Woods Dr
- 11803 New Forest Ct
- 4917 Bailey Woods Ln
- 5107 Morning Dove Mews
- 4112 Old Exchange Place
- 5101 Blossomwood Cir
- 11632 Fort Cosby Dr
- 4519 Bexwood Dr
- 10723 Timberun Rd
- 4518 Glen Tara Dr
- 12104 Southernbelle Ct
- 11418 Parrish Creek Ln
- 4124 Jefferson Ridge Dr
- 12112 Merit Grove Ct
- 10912 Genito Square Dr
- 3630 Irby Pond Dr
- 5124 Rollingway Rd
- 4510 Stigall Dr
- 4530 Stigall Dr
- 11401 Walnut Hollow Ct
- 11403 Walnut Hollow Ct
- 11418 Sunfield Dr
- 4519 Stigall Dr
- 11405 Walnut Hollow Ct
- 4600 Stigall Dr
- 11409 Walnut Hollow Ct
- 11400 Walnut Hollow Ct
- 11430 Sunfield Dr
- 4509 Stigall Dr
- 11410 Sunfield Dr
- 11349 Stigall Ct
- 11340 Stigall Ct
- 4610 Stigall Dr
- 11402 Walnut Hollow Ct
- 4501 Stigall Dr
- 11404 Walnut Hollow Ct
- 11419 Sunfield Dr
Your Personal Tour Guide
Ask me questions while you tour the home.