4520 Sundancer Loop SE Unit 4 Mandan, ND 58554
Estimated Value: $240,000 - $249,000
2
Beds
2
Baths
1,184
Sq Ft
$207/Sq Ft
Est. Value
About This Home
This home is located at 4520 Sundancer Loop SE Unit 4, Mandan, ND 58554 and is currently estimated at $244,856, approximately $206 per square foot. 4520 Sundancer Loop SE Unit 4 is a home located in Morton County with nearby schools including Lewis & Clark Elementary School, Mandan Middle School, and Mandan High School.
Ownership History
Date
Name
Owned For
Owner Type
Purchase Details
Closed on
Dec 19, 2025
Sold by
Leier Haylie and Macdonald Haylie E
Bought by
Hnl Legacy Llc
Current Estimated Value
Home Financials for this Owner
Home Financials are based on the most recent Mortgage that was taken out on this home.
Original Mortgage
$130,000
Outstanding Balance
$130,000
Interest Rate
5.5%
Mortgage Type
New Conventional
Estimated Equity
$114,856
Purchase Details
Closed on
Dec 4, 2020
Sold by
Men Nicole
Bought by
Leier Haylie
Home Financials for this Owner
Home Financials are based on the most recent Mortgage that was taken out on this home.
Original Mortgage
$160,237
Interest Rate
2.8%
Mortgage Type
New Conventional
Purchase Details
Closed on
Sep 5, 2017
Sold by
Fields David H and Fields Eileen M
Bought by
Moen Nicole
Purchase Details
Closed on
Nov 8, 2013
Sold by
Davis Tyler E
Bought by
Fields David H and Fields Eileen M
Purchase Details
Closed on
Jun 22, 2012
Sold by
Mitzel Contractors Inc
Bought by
Davis Tyler E
Home Financials for this Owner
Home Financials are based on the most recent Mortgage that was taken out on this home.
Original Mortgage
$139,500
Interest Rate
3.87%
Mortgage Type
New Conventional
Create a Home Valuation Report for This Property
The Home Valuation Report is an in-depth analysis detailing your home's value as well as a comparison with similar homes in the area
Home Values in the Area
Average Home Value in this Area
Purchase History
| Date | Buyer | Sale Price | Title Company |
|---|---|---|---|
| Hnl Legacy Llc | -- | Bismarck Title | |
| Leier Haylie | $176,000 | Bismarck Title Company | |
| Moen Nicole | $170,000 | North Dakota Guaranty & Titl | |
| Fields David H | $164,500 | Bismarck Title Company | |
| Davis Tyler E | $135,900 | Bismarck Title Company |
Source: Public Records
Mortgage History
| Date | Status | Borrower | Loan Amount |
|---|---|---|---|
| Open | Hnl Legacy Llc | $130,000 | |
| Previous Owner | Leier Haylie | $160,237 | |
| Previous Owner | Davis Tyler E | $139,500 |
Source: Public Records
Tax History
| Year | Tax Paid | Tax Assessment Tax Assessment Total Assessment is a certain percentage of the fair market value that is determined by local assessors to be the total taxable value of land and additions on the property. | Land | Improvement |
|---|---|---|---|---|
| 2024 | $2,355 | $108,650 | $0 | $0 |
| 2023 | $2,647 | $100,150 | $0 | $0 |
| 2022 | $2,406 | $93,200 | $0 | $0 |
| 2021 | $2,250 | $87,750 | $0 | $0 |
| 2020 | $2,354 | $151,100 | $0 | $0 |
| 2019 | $2,384 | $84,600 | $0 | $0 |
| 2018 | $2,345 | $87,800 | $10,000 | $77,800 |
| 2017 | $2,283 | $86,100 | $10,000 | $76,100 |
| 2016 | $2,281 | $91,150 | $10,000 | $81,150 |
| 2015 | $2,062 | $76,350 | $7,750 | $68,600 |
| 2014 | $2,318 | $76,850 | $5,200 | $71,650 |
| 2013 | $2,342 | $72,450 | $2,900 | $69,550 |
Source: Public Records
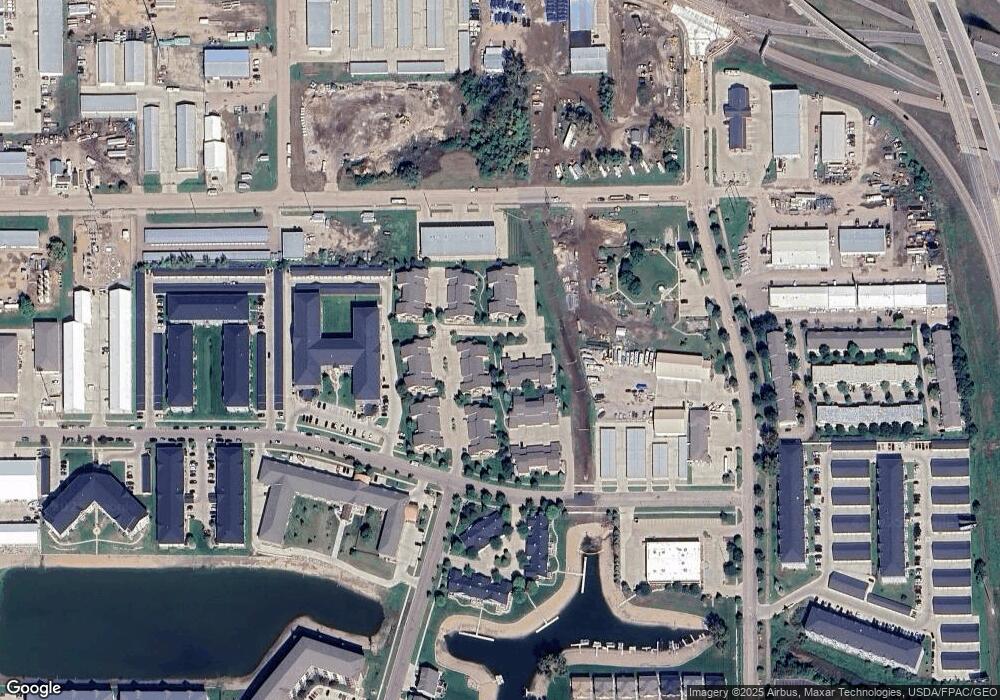
Map
Nearby Homes
- 4500 Sundancer Loop SE Unit 2
- 2120 Sundancer Loop SE Unit 5
- 2200 Shoal Loop SE
- 2454 Waterpark Loop SE
- 57 Captain Marsh Dr
- 2625 Douglas Place SE
- 2617 Verity Ln SE
- 2109 Bridgeview Ct SE
- 2207 Bridgeview Ct
- 2313 Pirates Loop SE
- 4020 Mckenzie Dr SE Unit 5
- 3801 Gale Cir SE
- 4004 Bayport Place SE
- 4103 Bayport Place SE
- 3507 24th St SE
- 2510 34th Ave SE
- 3717 Mckenzie Dr SE
- 3305 Bay Shore Bend SE
- 3410 Heartwood Place
- 3406 Heartwood Dr SE
- 4520 Sundancer Loop SE
- 4520 Sundancer Loop SE Unit 3
- 4520 Sundancer Loop SE Unit 6
- 4520 Sundancer Loop SE Unit 2
- 4500 Sundancer Loop SE
- 4500 Sundancer Loop SE Unit 5
- 4500 Sundancer Loop SE Unit 1
- 4500 Sundancer Loop SE Unit 3
- 4521 Sundancer Loop SE
- 4521 Sundancer Loop SE Unit 2
- 4521 Sundancer Loop SE Unit 1
- 2100 Sundancer Loop SE
- 2100 Sundancer Loop SE Unit 5
- 2100 Sundancer Loop SE Unit 4
- 2100 Sundancer Loop SE Unit 2
- 2100 Sundancer Loop SE Unit 1
- 1521 Sundancer Loop SE
- 4440 Sundancer Loop SE
- 4440 Sundancer Loop SE Unit 3
- 4440 Sundancer Loop SE Unit 1
Your Personal Tour Guide
Ask me questions while you tour the home.