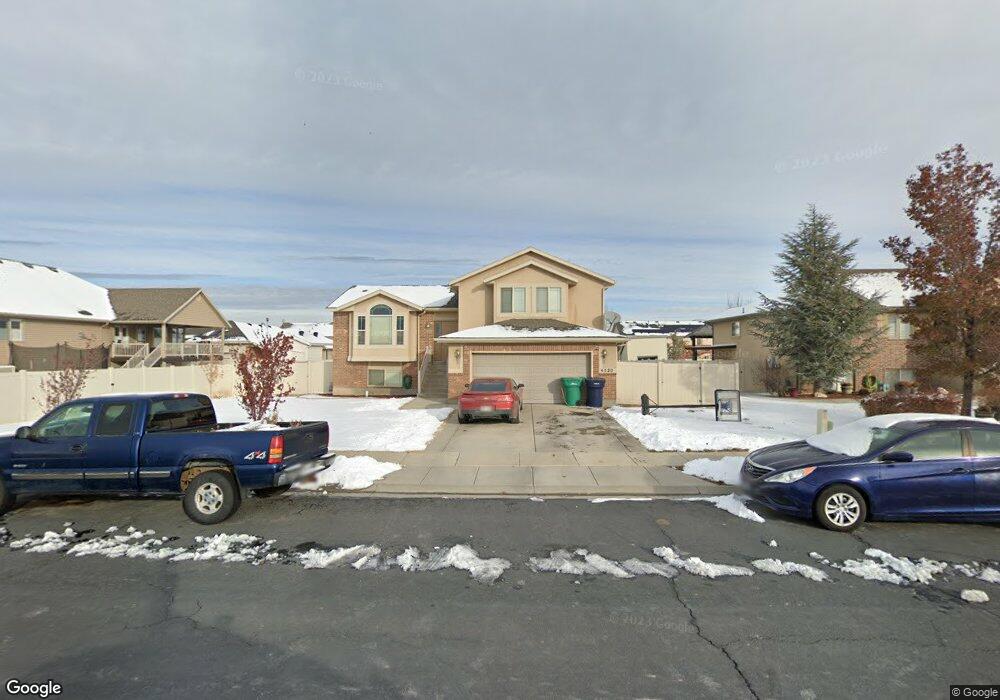
4520 W 5375 S Hooper, UT 84315
Estimated Value: $539,101 - $586,000
5
Beds
4
Baths
2,158
Sq Ft
$262/Sq Ft
Est. Value
About This Home
This home is located at 4520 W 5375 S, Hooper, UT 84315 and is currently estimated at $564,525, approximately $261 per square foot. 4520 W 5375 S is a home located in Weber County with nearby schools including Freedom School, Roy Junior High School, and Roy High School.
Ownership History
Date
Name
Owned For
Owner Type
Purchase Details
Closed on
Sep 28, 2012
Sold by
Clyde Brett S and Clyde Carrie T
Bought by
Dean Matthew L and Dean Kelly D
Current Estimated Value
Home Financials for this Owner
Home Financials are based on the most recent Mortgage that was taken out on this home.
Original Mortgage
$198,341
Outstanding Balance
$138,888
Interest Rate
3.75%
Mortgage Type
FHA
Estimated Equity
$425,637
Purchase Details
Closed on
Jun 6, 2007
Sold by
Dhi Builders Llc
Bought by
Clyde Brett S and Clyde Carrie T
Home Financials for this Owner
Home Financials are based on the most recent Mortgage that was taken out on this home.
Original Mortgage
$184,000
Interest Rate
6.14%
Mortgage Type
New Conventional
Purchase Details
Closed on
May 12, 2006
Sold by
M & D Developers Llc
Bought by
Dhi Builders Llc
Create a Home Valuation Report for This Property
The Home Valuation Report is an in-depth analysis detailing your home's value as well as a comparison with similar homes in the area
Home Values in the Area
Average Home Value in this Area
Purchase History
| Date | Buyer | Sale Price | Title Company |
|---|---|---|---|
| Dean Matthew L | -- | First American Title Company | |
| Clyde Brett S | -- | Equity Title Layton | |
| Dhi Builders Llc | -- | Heritage West Title Ins |
Source: Public Records
Mortgage History
| Date | Status | Borrower | Loan Amount |
|---|---|---|---|
| Open | Dean Matthew L | $198,341 | |
| Previous Owner | Clyde Brett S | $184,000 |
Source: Public Records
Tax History Compared to Growth
Tax History
| Year | Tax Paid | Tax Assessment Tax Assessment Total Assessment is a certain percentage of the fair market value that is determined by local assessors to be the total taxable value of land and additions on the property. | Land | Improvement |
|---|---|---|---|---|
| 2025 | $2,712 | $472,948 | $200,052 | $272,896 |
| 2024 | $2,743 | $267,849 | $110,028 | $157,821 |
| 2023 | $2,904 | $281,050 | $109,606 | $171,444 |
| 2022 | $2,911 | $288,200 | $84,773 | $203,427 |
| 2021 | $2,451 | $409,000 | $108,815 | $300,185 |
| 2020 | $2,368 | $362,000 | $103,792 | $258,208 |
| 2019 | $2,262 | $327,000 | $102,513 | $224,487 |
| 2018 | $2,047 | $283,000 | $67,355 | $215,645 |
| 2017 | $2,114 | $283,000 | $66,842 | $216,158 |
| 2016 | $2,157 | $155,893 | $36,485 | $119,408 |
| 2015 | $2,070 | $147,407 | $33,685 | $113,722 |
| 2014 | $1,848 | $128,038 | $28,282 | $99,756 |
Source: Public Records
Map
Nearby Homes
- 4449 W 5325 S
- 4337 W 5430 S Unit A
- 4309 W 5430 St #B S
- 4700 W 5500 S
- 5116 S 4300 W
- 5270 S 4200 W
- 5539 S 4175 W
- 4632 W 5750 S
- 4556 W 4950 S
- 4218 W 5050 S
- 5465 S 4050 W
- 5013 S 4150 W
- 4931 S 4700 W
- 5644 S 4075 W
- 462 S 4450 W Unit 504
- 4990 S 4075 W
- 5235 Midland Dr
- 4021 W 5000 S
- 4141 W 4875 S
- 4890 S 4075 W