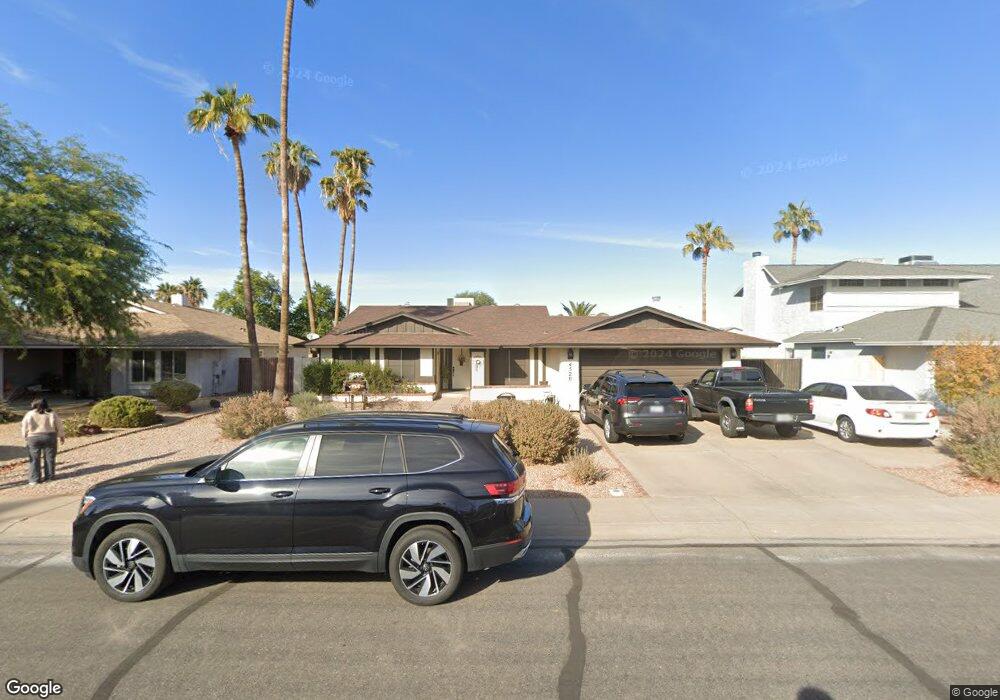
4520 W Commonwealth Place Chandler, AZ 85226
West Chandler NeighborhoodEstimated Value: $454,725 - $542,000
4
Beds
2
Baths
1,827
Sq Ft
$280/Sq Ft
Est. Value
About This Home
This home is located at 4520 W Commonwealth Place, Chandler, AZ 85226 and is currently estimated at $511,931, approximately $280 per square foot. 4520 W Commonwealth Place is a home located in Maricopa County with nearby schools including Kyrene de la Paloma School, Kyrene del Pueblo Middle School, and Corona Del Sol High School.
Ownership History
Date
Name
Owned For
Owner Type
Purchase Details
Closed on
Jan 31, 2014
Sold by
Johnson Robert C and Johnson Robert Charles
Bought by
Hutcheson Reginald and Hutcheson Liliana
Current Estimated Value
Home Financials for this Owner
Home Financials are based on the most recent Mortgage that was taken out on this home.
Original Mortgage
$209,605
Outstanding Balance
$160,855
Interest Rate
4.75%
Mortgage Type
FHA
Estimated Equity
$351,076
Purchase Details
Closed on
Nov 13, 1996
Sold by
Johnson Sallyann
Bought by
Johnson Robert Charles
Home Financials for this Owner
Home Financials are based on the most recent Mortgage that was taken out on this home.
Original Mortgage
$22,000
Interest Rate
7.95%
Purchase Details
Closed on
Sep 26, 1996
Sold by
Bell Lawrence Michael and Bell Susan Cabrera
Bought by
Johnson Robert Charles and Johnson Sallyann
Home Financials for this Owner
Home Financials are based on the most recent Mortgage that was taken out on this home.
Original Mortgage
$22,000
Interest Rate
7.95%
Create a Home Valuation Report for This Property
The Home Valuation Report is an in-depth analysis detailing your home's value as well as a comparison with similar homes in the area
Home Values in the Area
Average Home Value in this Area
Purchase History
| Date | Buyer | Sale Price | Title Company |
|---|---|---|---|
| Hutcheson Reginald | $229,000 | Chicago Title Agency Inc | |
| Johnson Robert Charles | -- | -- | |
| Johnson Robert Charles | -- | -- |
Source: Public Records
Mortgage History
| Date | Status | Borrower | Loan Amount |
|---|---|---|---|
| Open | Hutcheson Reginald | $209,605 | |
| Previous Owner | Johnson Robert Charles | $22,000 |
Source: Public Records
Tax History Compared to Growth
Tax History
| Year | Tax Paid | Tax Assessment Tax Assessment Total Assessment is a certain percentage of the fair market value that is determined by local assessors to be the total taxable value of land and additions on the property. | Land | Improvement |
|---|---|---|---|---|
| 2025 | $1,831 | $22,990 | -- | -- |
| 2024 | $1,752 | $21,896 | -- | -- |
| 2023 | $1,752 | $37,870 | $7,570 | $30,300 |
| 2022 | $1,667 | $28,430 | $5,680 | $22,750 |
| 2021 | $1,758 | $26,820 | $5,360 | $21,460 |
| 2020 | $1,718 | $25,270 | $5,050 | $20,220 |
| 2019 | $1,668 | $23,670 | $4,730 | $18,940 |
| 2018 | $1,613 | $22,060 | $4,410 | $17,650 |
| 2017 | $1,537 | $20,870 | $4,170 | $16,700 |
| 2016 | $1,569 | $20,010 | $4,000 | $16,010 |
| 2015 | $1,448 | $18,810 | $3,760 | $15,050 |
Source: Public Records
Map
Nearby Homes
- 4628 W Buffalo St
- 4554 W Detroit St
- 4624 W Chicago St
- 4613 W Chicago St Unit 2
- 295 N Rural Rd Unit 160
- 295 N Rural Rd Unit 128
- 295 N Rural Rd Unit 202
- 390 N Enterprise Place Unit B37
- 390 N Enterprise Place Unit A6
- 5151 W Glenview Place
- 5143 W Mercury Way
- 5137 W Jupiter Way
- 5043 W Whitten St
- 4650 W Geronimo St
- 4772 W Joshua Blvd
- 4790 W Geronimo St
- 5455 W Buffalo St
- 3841 W Elgin St
- 4174 W Harrison St
- 5041 W Kesler Ln
- 4524 W Commonwealth Place
- 4516 W Commonwealth Place
- 4517 W Buffalo St
- 4528 W Commonwealth Place
- 4512 W Commonwealth Place
- 4515 W Commonwealth Place
- 4513 W Buffalo St
- 4519 W Commonwealth Place
- 4511 W Commonwealth Place
- 4529 W Buffalo St
- 4523 W Commonwealth Place
- 4523 W Commonwealth Place
- 4532 W Commonwealth Place
- 4509 W Buffalo St
- 4527 W Commonwealth Place
- 23 S Kenneth Place
- 4603 W Buffalo St
- 4514 W Mercury Way
- 4522 W Buffalo St
- 4518 W Mercury Way