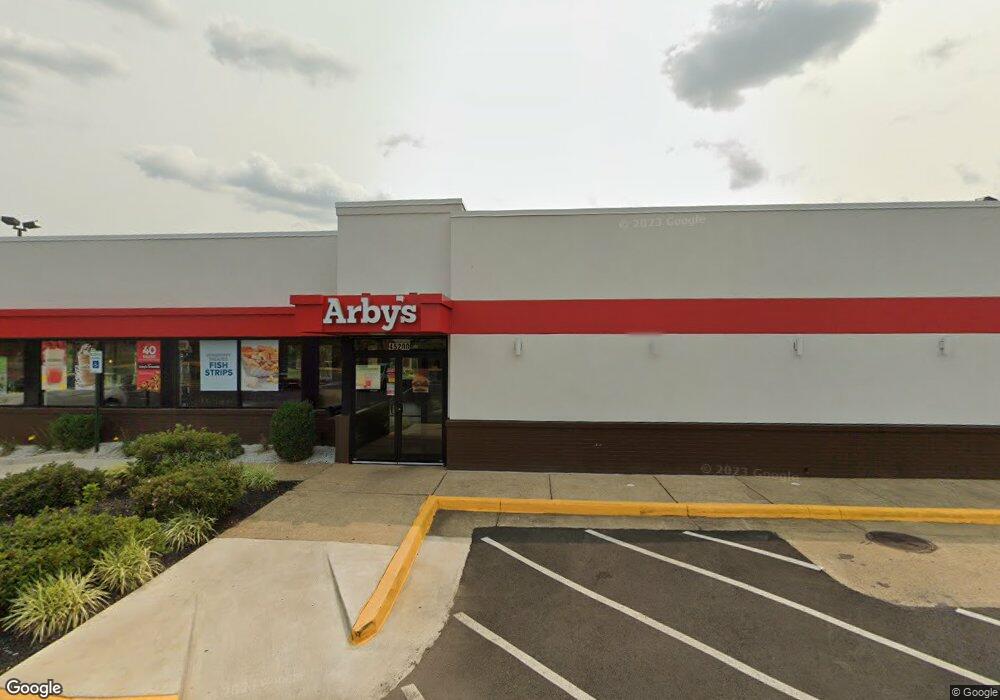
45200 Monterey Place Sterling, VA 20166
Estimated Value: $1,724,061
--
Bed
--
Bath
3,341
Sq Ft
$516/Sq Ft
Est. Value
About This Home
This home is located at 45200 Monterey Place, Sterling, VA 20166 and is currently estimated at $1,724,061, approximately $516 per square foot. 45200 Monterey Place is a home located in Loudoun County with nearby schools including Discovery Elementary School, Farmwell Station Middle School, and Broad Run High School.
Ownership History
Date
Name
Owned For
Owner Type
Purchase Details
Closed on
Feb 16, 2021
Sold by
King Of Northern Virginia
Bought by
Laadam Family Llc
Current Estimated Value
Home Financials for this Owner
Home Financials are based on the most recent Mortgage that was taken out on this home.
Original Mortgage
$489,511
Outstanding Balance
$437,814
Interest Rate
2.7%
Mortgage Type
Credit Line Revolving
Estimated Equity
$1,286,247
Purchase Details
Closed on
Feb 23, 1998
Sold by
North Dulles Retail Assoc Ltd
Bought by
King Of Northern Va
Home Financials for this Owner
Home Financials are based on the most recent Mortgage that was taken out on this home.
Original Mortgage
$1,200,000
Interest Rate
6.9%
Mortgage Type
Credit Line Revolving
Create a Home Valuation Report for This Property
The Home Valuation Report is an in-depth analysis detailing your home's value as well as a comparison with similar homes in the area
Home Values in the Area
Average Home Value in this Area
Purchase History
| Date | Buyer | Sale Price | Title Company |
|---|---|---|---|
| Laadam Family Llc | $1,300,000 | Attorney | |
| King Of Northern Va | -- | -- |
Source: Public Records
Mortgage History
| Date | Status | Borrower | Loan Amount |
|---|---|---|---|
| Open | Laadam Family Llc | $489,511 | |
| Open | Laadam Family Llc | $699,489 | |
| Previous Owner | King Of Northern Va | $1,200,000 |
Source: Public Records
Tax History Compared to Growth
Tax History
| Year | Tax Paid | Tax Assessment Tax Assessment Total Assessment is a certain percentage of the fair market value that is determined by local assessors to be the total taxable value of land and additions on the property. | Land | Improvement |
|---|---|---|---|---|
| 2025 | $13,011 | $1,406,570 | $1,002,300 | $404,270 |
| 2024 | $13,415 | $1,334,860 | $1,082,000 | $252,860 |
| 2023 | $11,563 | $1,321,490 | $961,800 | $359,690 |
| 2022 | $11,247 | $1,263,720 | $961,800 | $301,920 |
| 2021 | $12,051 | $1,229,680 | $969,800 | $259,880 |
| 2020 | $12,856 | $1,242,150 | $969,800 | $272,350 |
| 2019 | $13,158 | $1,259,110 | $969,800 | $289,310 |
| 2018 | $14,273 | $1,315,470 | $969,800 | $345,670 |
| 2017 | $17,324 | $1,315,840 | $969,800 | $346,040 |
| 2016 | $15,066 | $1,315,840 | $0 | $0 |
| 2015 | $18,466 | $657,200 | $0 | $657,200 |
| 2014 | $19,575 | $733,020 | $0 | $733,020 |
Source: Public Records
Map
Nearby Homes
- 45439 Baggett Terrace
- 46294 Mount Milstead Terrace Unit 400
- 46270 Mount Allen Terrace Unit 300
- 21630 Hawksbill High Cir Unit 302
- 46294 Mount Milstead Terrace Unit 303
- 46270 Mount Allen Terrace Unit 201
- 45445 Timber Trail Square
- 21897 Elkins Terrace
- 45495 Caboose Terrace Unit 302
- 22078 Manning Square
- 45481 Bluemont Junction Square
- 45550 Reading Terrace
- 21901 Golden Spike Terrace
- 45458 Oak Trail Square
- 1028A Brixton Ct
- 1044 Brixton Ct Unit B
- 1006 S Greenthorn Ave
- 1048A Brixton Ct
- 1048A Margate Ct
- 1034 Salisbury Ct
- 21980 Colorado Dr
- 45250 Monterey Place
- 21990 Colorado Dr
- 45220 Commercial Dr
- 45130 Columbia Place
- 22015 Dulles Retail Plaza
- 22000 Dulles Retail Plaza Unit 154
- 22000 Dulles Retail Plaza
- 21830 Pacific Blvd
- 45131 Columbia Place
- 21826 Pacific Blvd
- 183 Ruritan Rd
- 45130 Waxpool Rd
- 102 Shaw Rd
- 103 Shaw Rd
- 22080 Pacific Blvd
- 45216 Waxpool Rd
- 45101 Warp Dr
- 116 Ruritan Rd
- 45416 Baggett Terrace