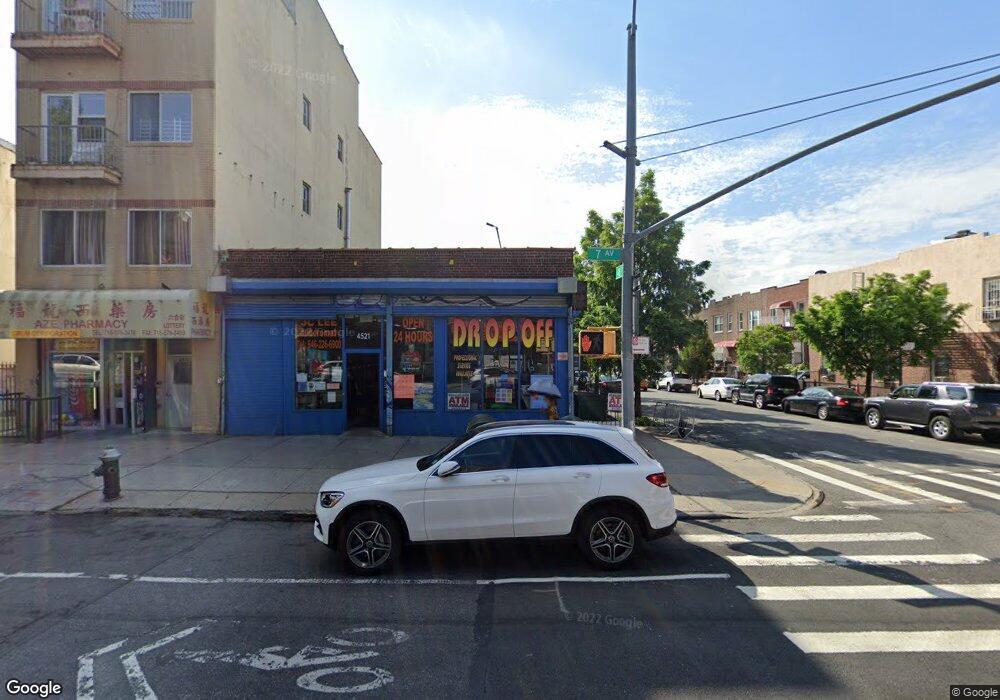
4521 7th Ave Brooklyn, NY 11220
Sunset Park NeighborhoodEstimated Value: $3,113,533
--
Bed
--
Bath
2,993
Sq Ft
$1,040/Sq Ft
Est. Value
About This Home
This home is located at 4521 7th Ave, Brooklyn, NY 11220 and is currently estimated at $3,113,533, approximately $1,040 per square foot. 4521 7th Ave is a home located in Kings County with nearby schools including P.S. 169 Sunset Park, I.S. 223 The Montauk, and Kehilath Yakov Pupa.
Ownership History
Date
Name
Owned For
Owner Type
Purchase Details
Closed on
Mar 13, 2014
Sold by
Parkset 7Th Ave Llc
Bought by
Dong Shao Realty Llc
Current Estimated Value
Home Financials for this Owner
Home Financials are based on the most recent Mortgage that was taken out on this home.
Original Mortgage
$900,000
Outstanding Balance
$681,909
Interest Rate
4.33%
Mortgage Type
Commercial
Estimated Equity
$2,431,624
Create a Home Valuation Report for This Property
The Home Valuation Report is an in-depth analysis detailing your home's value as well as a comparison with similar homes in the area
Home Values in the Area
Average Home Value in this Area
Purchase History
| Date | Buyer | Sale Price | Title Company |
|---|---|---|---|
| Dong Shao Realty Llc | $1,897,000 | -- |
Source: Public Records
Mortgage History
| Date | Status | Borrower | Loan Amount |
|---|---|---|---|
| Open | Dong Shao Realty Llc | $900,000 |
Source: Public Records
Tax History Compared to Growth
Tax History
| Year | Tax Paid | Tax Assessment Tax Assessment Total Assessment is a certain percentage of the fair market value that is determined by local assessors to be the total taxable value of land and additions on the property. | Land | Improvement |
|---|---|---|---|---|
| 2025 | $21,897 | $308,250 | $20,250 | $288,000 |
| 2024 | $21,897 | $227,700 | $20,250 | $207,450 |
| 2023 | $21,874 | $209,250 | $20,250 | $189,000 |
| 2022 | $20,037 | $186,300 | $20,250 | $166,050 |
| 2021 | $19,105 | $178,650 | $20,250 | $158,400 |
| 2020 | $12,202 | $231,750 | $20,250 | $211,500 |
| 2019 | $22,909 | $221,400 | $20,250 | $201,150 |
| 2018 | $21,982 | $238,050 | $20,250 | $217,800 |
| 2017 | $20,083 | $223,650 | $20,250 | $203,400 |
| 2016 | $18,447 | $209,700 | $20,250 | $189,450 |
| 2015 | $10,724 | $196,650 | $20,250 | $176,400 |
| 2014 | $10,724 | $177,300 | $20,250 | $157,050 |
Source: Public Records
Map
Nearby Homes