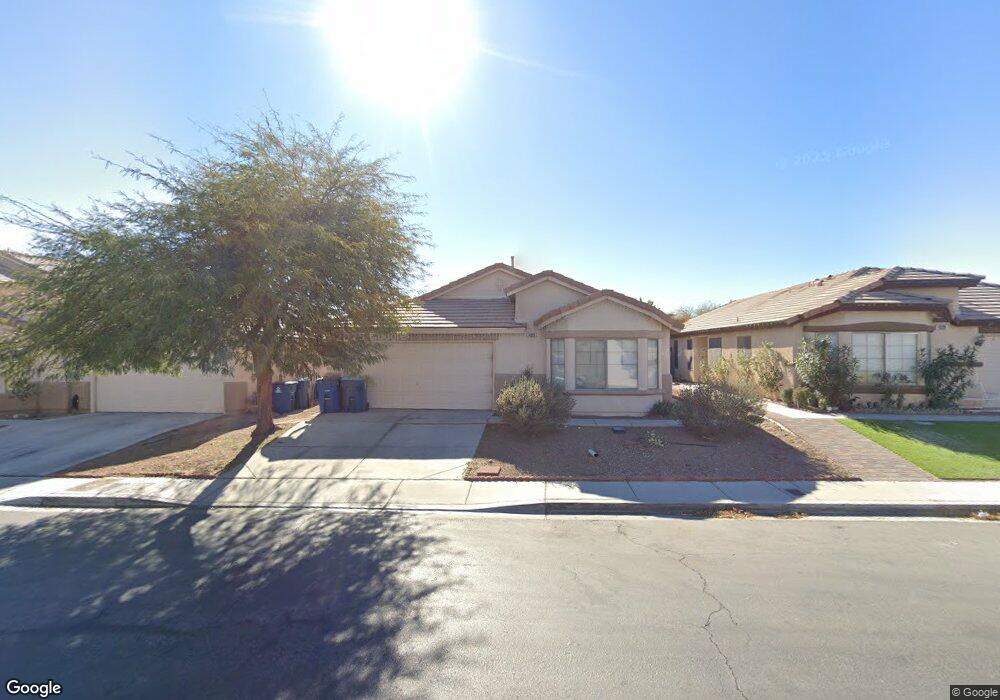
4521 Gracemont Ave Unit 3 Las Vegas, NV 89139
Coronado Ranch NeighborhoodEstimated Value: $430,415 - $454,000
4
Beds
2
Baths
1,674
Sq Ft
$261/Sq Ft
Est. Value
About This Home
This home is located at 4521 Gracemont Ave Unit 3, Las Vegas, NV 89139 and is currently estimated at $437,604, approximately $261 per square foot. 4521 Gracemont Ave Unit 3 is a home located in Clark County with nearby schools including Dr. Beverly S. Mathis Elementary School, Lawrence & Heidi Canarelli Middle School, and Desert Oasis High School.
Ownership History
Date
Name
Owned For
Owner Type
Purchase Details
Closed on
Jan 10, 2010
Sold by
Hutchinson Glenn A
Bought by
Hutchinson Glenn A and Hutchinson Lorna
Current Estimated Value
Home Financials for this Owner
Home Financials are based on the most recent Mortgage that was taken out on this home.
Original Mortgage
$140,650
Outstanding Balance
$92,719
Interest Rate
5.03%
Mortgage Type
New Conventional
Estimated Equity
$344,885
Purchase Details
Closed on
Nov 14, 2002
Sold by
Woodside Homes Of Nevada Inc
Bought by
Hutchinson Glenn A
Home Financials for this Owner
Home Financials are based on the most recent Mortgage that was taken out on this home.
Original Mortgage
$151,800
Interest Rate
5.89%
Purchase Details
Closed on
Nov 7, 2002
Sold by
Hutchinson Glenn A and Charles Lorna
Bought by
Hutchinson Glenn A
Home Financials for this Owner
Home Financials are based on the most recent Mortgage that was taken out on this home.
Original Mortgage
$151,800
Interest Rate
5.89%
Create a Home Valuation Report for This Property
The Home Valuation Report is an in-depth analysis detailing your home's value as well as a comparison with similar homes in the area
Home Values in the Area
Average Home Value in this Area
Purchase History
| Date | Buyer | Sale Price | Title Company |
|---|---|---|---|
| Hutchinson Glenn A | -- | Accommodation | |
| Hutchinson Glenn A | $168,688 | United Title | |
| Hutchinson Glenn A | -- | United Title |
Source: Public Records
Mortgage History
| Date | Status | Borrower | Loan Amount |
|---|---|---|---|
| Open | Hutchinson Glenn A | $140,650 | |
| Previous Owner | Hutchinson Glenn A | $151,800 |
Source: Public Records
Tax History Compared to Growth
Tax History
| Year | Tax Paid | Tax Assessment Tax Assessment Total Assessment is a certain percentage of the fair market value that is determined by local assessors to be the total taxable value of land and additions on the property. | Land | Improvement |
|---|---|---|---|---|
| 2025 | $2,124 | $111,736 | $40,250 | $71,486 |
| 2024 | $1,968 | $111,736 | $40,250 | $71,486 |
| 2023 | $1,310 | $99,198 | $31,500 | $67,698 |
| 2022 | $1,822 | $88,348 | $26,600 | $61,748 |
| 2021 | $1,687 | $83,138 | $24,500 | $58,638 |
| 2020 | $1,564 | $82,597 | $24,500 | $58,097 |
| 2019 | $1,466 | $78,522 | $21,350 | $57,172 |
| 2018 | $1,399 | $72,931 | $17,850 | $55,081 |
| 2017 | $2,159 | $73,619 | $17,850 | $55,769 |
| 2016 | $1,310 | $61,129 | $10,500 | $50,629 |
| 2015 | $1,309 | $46,573 | $9,800 | $36,773 |
| 2014 | $1,520 | $46,900 | $6,300 | $40,600 |
Source: Public Records
Map
Nearby Homes
- 7850 Flagler St Unit 2
- 7682 Rafter Ct
- 4732 Lone Grove Dr
- 4315 W Maulding Ave
- 7514 Rogers St
- 4832 Englewood Ave
- 0 W Maulding Ave
- 4801 Pagosa Springs Dr
- 4930 W Maulding Ave
- 7477 Ullom Dr
- 7923 Homer Ct
- 4998 Lavaliere Ave
- 7689 Black River St
- 8175 Arville St Unit 41
- 8175 Arville St Unit 315
- 8175 Arville St Unit 271
- 8175 Arville St Unit 171
- 8175 Arville St Unit 70
- 8175 Arville St Unit 300
- 8175 Arville St Unit 218
- 4513 Gracemont Ave
- 4505 Gracemont Ave
- 4537 Gracemont Ave Unit 3
- 7773 Hardesty Ct
- 4545 Gracemont Ave
- 4497 Gracemont Ave Unit 3
- 7772 Pacific Rim Ct Unit 3
- 4516 Pacific Sun Ave
- 7765 Hardesty Ct Unit 3
- 4508 Pacific Sun Ave
- 4524 Pacific Sun Ave
- 4553 Gracemont Ave Unit 3
- 4489 Gracemont Ave
- 7764 Pacific Rim Ct
- 7764 Pacific Rim Ct
- 4500 Pacific Sun Ave
- 4500 Pacific Sun Ave
- 4500 Pacific Sun Ave
- 4532 Pacific Sun Ave
- 4540 Pacific Sun Ave