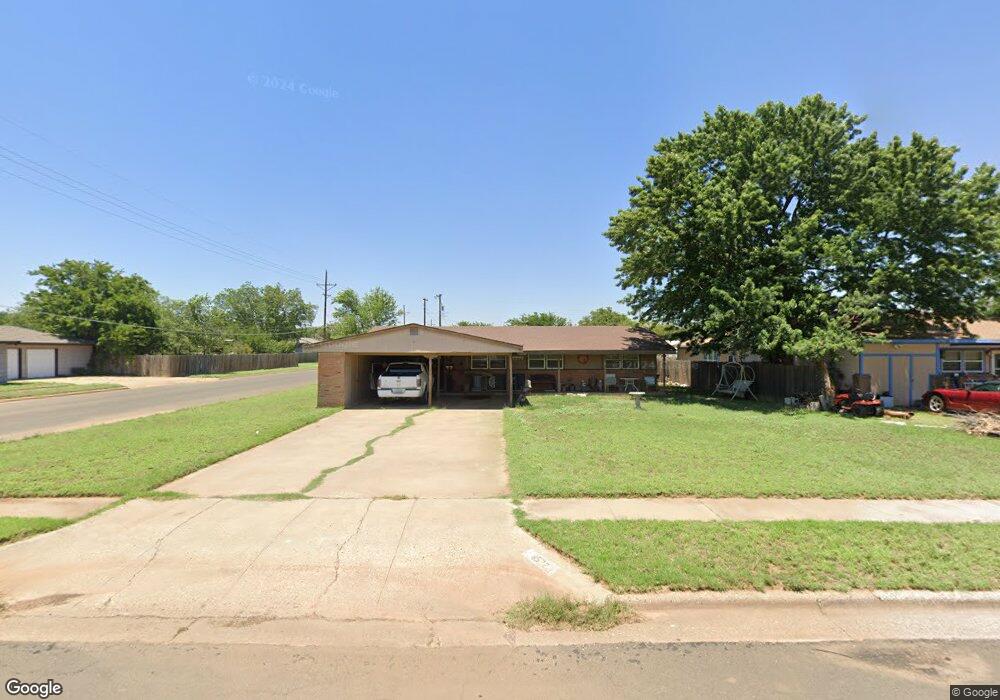
4522 39th St Lubbock, TX 79414
Stubbs-Stewart NeighborhoodEstimated Value: $154,000 - $166,198
3
Beds
2
Baths
1,632
Sq Ft
$98/Sq Ft
Est. Value
About This Home
This home is located at 4522 39th St, Lubbock, TX 79414 and is currently estimated at $160,550, approximately $98 per square foot. 4522 39th St is a home located in Lubbock County with nearby schools including Stewart Elementary School, Commander William C. McCool Academy, and Irons Middle School.
Ownership History
Date
Name
Owned For
Owner Type
Purchase Details
Closed on
Aug 27, 2020
Sold by
Alvarez Diana and Alvarez Diana
Bought by
Perez Omar
Current Estimated Value
Home Financials for this Owner
Home Financials are based on the most recent Mortgage that was taken out on this home.
Original Mortgage
$108,000
Outstanding Balance
$86,351
Interest Rate
3%
Mortgage Type
New Conventional
Estimated Equity
$74,199
Purchase Details
Closed on
Jun 14, 2002
Sold by
Whitney Henry E
Bought by
Perez Omar
Purchase Details
Closed on
Jun 27, 2000
Sold by
Simmons Virgil C Estate
Bought by
Perez Omar
Purchase Details
Closed on
Mar 8, 1991
Bought by
Perez Omar
Create a Home Valuation Report for This Property
The Home Valuation Report is an in-depth analysis detailing your home's value as well as a comparison with similar homes in the area
Home Values in the Area
Average Home Value in this Area
Purchase History
| Date | Buyer | Sale Price | Title Company |
|---|---|---|---|
| Perez Omar | -- | None Available | |
| Perez Omar | -- | -- | |
| Perez Omar | -- | -- | |
| Perez Omar | -- | -- |
Source: Public Records
Mortgage History
| Date | Status | Borrower | Loan Amount |
|---|---|---|---|
| Open | Perez Omar | $108,000 |
Source: Public Records
Tax History Compared to Growth
Tax History
| Year | Tax Paid | Tax Assessment Tax Assessment Total Assessment is a certain percentage of the fair market value that is determined by local assessors to be the total taxable value of land and additions on the property. | Land | Improvement |
|---|---|---|---|---|
| 2025 | $1,378 | $137,474 | $25,000 | $112,474 |
| 2024 | $1,378 | $157,859 | $25,000 | $132,859 |
| 2023 | $2,445 | $131,548 | $8,636 | $122,912 |
| 2022 | $2,421 | $119,589 | $8,636 | $126,948 |
| 2021 | $2,626 | $122,618 | $8,636 | $113,982 |
| 2020 | $2,149 | $98,834 | $8,636 | $90,198 |
| 2019 | $2,017 | $89,849 | $8,636 | $81,213 |
| 2018 | $2,212 | $98,397 | $8,636 | $89,761 |
| 2017 | $2,215 | $98,397 | $8,636 | $89,761 |
| 2016 | $2,102 | $93,411 | $8,636 | $84,775 |
| 2015 | $1,675 | $86,212 | $8,636 | $77,576 |
| 2014 | $1,675 | $83,670 | $4,420 | $79,250 |
Source: Public Records
Map
Nearby Homes