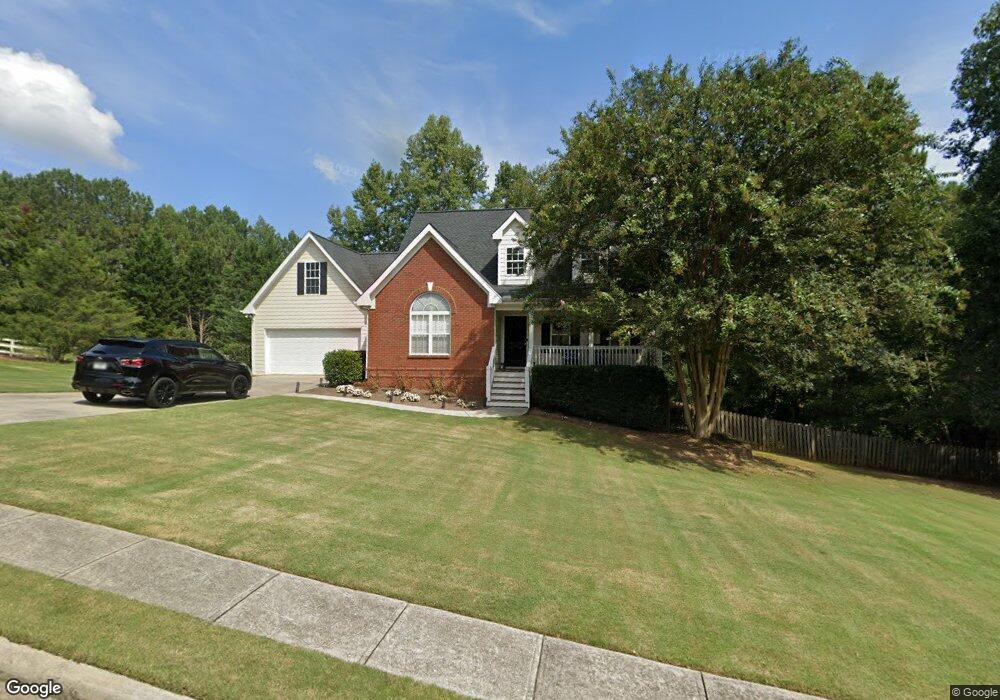
4522 Mulberry Fields Ln Unit 1 Auburn, GA 30011
Estimated Value: $463,000 - $523,684
5
Beds
4
Baths
3,172
Sq Ft
$155/Sq Ft
Est. Value
About This Home
This home is located at 4522 Mulberry Fields Ln Unit 1, Auburn, GA 30011 and is currently estimated at $492,171, approximately $155 per square foot. 4522 Mulberry Fields Ln Unit 1 is a home located in Gwinnett County with nearby schools including Duncan Creek Elementary School, Frank N. Osborne Middle School, and Mill Creek High School.
Ownership History
Date
Name
Owned For
Owner Type
Purchase Details
Closed on
Jun 24, 2011
Sold by
Porter Robert
Bought by
Blanchard Jason M and Blanchard Jill M
Current Estimated Value
Home Financials for this Owner
Home Financials are based on the most recent Mortgage that was taken out on this home.
Original Mortgage
$141,324
Outstanding Balance
$99,292
Interest Rate
5.12%
Mortgage Type
FHA
Estimated Equity
$392,879
Purchase Details
Closed on
Jan 11, 2006
Sold by
Lougher J Scot and Lougher Heather L
Bought by
Porter Robert
Home Financials for this Owner
Home Financials are based on the most recent Mortgage that was taken out on this home.
Original Mortgage
$217,847
Interest Rate
7.94%
Mortgage Type
New Conventional
Purchase Details
Closed on
Jun 22, 2001
Sold by
Creekview Bldrs Inc
Bought by
Lougher Scot and Lougher Heather L
Home Financials for this Owner
Home Financials are based on the most recent Mortgage that was taken out on this home.
Original Mortgage
$149,600
Interest Rate
7.14%
Mortgage Type
New Conventional
Create a Home Valuation Report for This Property
The Home Valuation Report is an in-depth analysis detailing your home's value as well as a comparison with similar homes in the area
Home Values in the Area
Average Home Value in this Area
Purchase History
| Date | Buyer | Sale Price | Title Company |
|---|---|---|---|
| Blanchard Jason M | $145,000 | -- | |
| Porter Robert | $214,000 | -- | |
| Lougher Scot | $187,000 | -- |
Source: Public Records
Mortgage History
| Date | Status | Borrower | Loan Amount |
|---|---|---|---|
| Open | Blanchard Jason M | $141,324 | |
| Previous Owner | Porter Robert | $217,847 | |
| Previous Owner | Lougher Scot | $149,600 |
Source: Public Records
Tax History Compared to Growth
Tax History
| Year | Tax Paid | Tax Assessment Tax Assessment Total Assessment is a certain percentage of the fair market value that is determined by local assessors to be the total taxable value of land and additions on the property. | Land | Improvement |
|---|---|---|---|---|
| 2025 | $5,594 | $208,360 | $36,080 | $172,280 |
| 2024 | $5,069 | $174,200 | $34,400 | $139,800 |
| 2023 | $5,069 | $119,160 | $24,000 | $95,160 |
| 2022 | $3,900 | $119,160 | $24,000 | $95,160 |
| 2021 | $3,668 | $106,040 | $18,000 | $88,040 |
| 2020 | $3,692 | $106,040 | $18,000 | $88,040 |
| 2019 | $3,577 | $106,040 | $18,000 | $88,040 |
| 2018 | $2,429 | $64,080 | $11,600 | $52,480 |
| 2016 | $2,451 | $64,080 | $11,600 | $52,480 |
| 2015 | $2,467 | $64,080 | $11,600 | $52,480 |
| 2014 | $2,479 | $64,080 | $11,600 | $52,480 |
Source: Public Records
Map
Nearby Homes
- 4533 Mulberry Fields Ln
- 4363 Saddlecreek Ct
- 1109 Woodtrace Ln
- 1008 Woodtrace Ln
- 1678 Thomas Dr
- 4293 Saddlecreek Ct
- 5110 Mulberry Pass Ct
- 1646 Thomas Dr
- 4910 Sierra Creek Dr NE
- 1431 Torrington Dr
- 4336 Azalea Ridge Way
- 4759 Highland Point Dr
- 4819 Sierra Creek Dr
- 4367 Azalea Ridge Way
- 4357 Azalea Ridge Way
- 1587 Cronic Town Rd Unit 1
- 662 Eagles Nest Cir
- 4297 Azalea Ridge Dr
- 4266 Azalea Ridge Dr
- 4542 Mulberry Fields Ln Unit 1
- 4502 Mulberry Fields Ln
- 4513 Mulberry Fields Ln Unit 1
- 4552 Mulberry Fields Ln
- 4523 Mulberry Fields Ln
- 4533 Mulberry Fields Ln NE
- 4543 Mulberry Fields Ln Unit 1
- 831 Mount Moriah Rd
- 4563 Mulberry Fields Ln Unit 1
- 918 Mulberry Fields Cove
- 4573 Mulberry Fields Ln Unit 1
- 4592 Mulberry Fields Ln
- 928 Mulberry Fields Cove
- 775 Mount Moriah Rd
- 0 Mulberry Fields Ln NE Unit 8535085
- 0 Mulberry Fields Ln NE
- 938 Mulberry Fields Cove
- 4583 Mulberry Fields Ln
- 755 Mount Moriah Rd
- 4593 Mulberry Fields Ln Unit 1