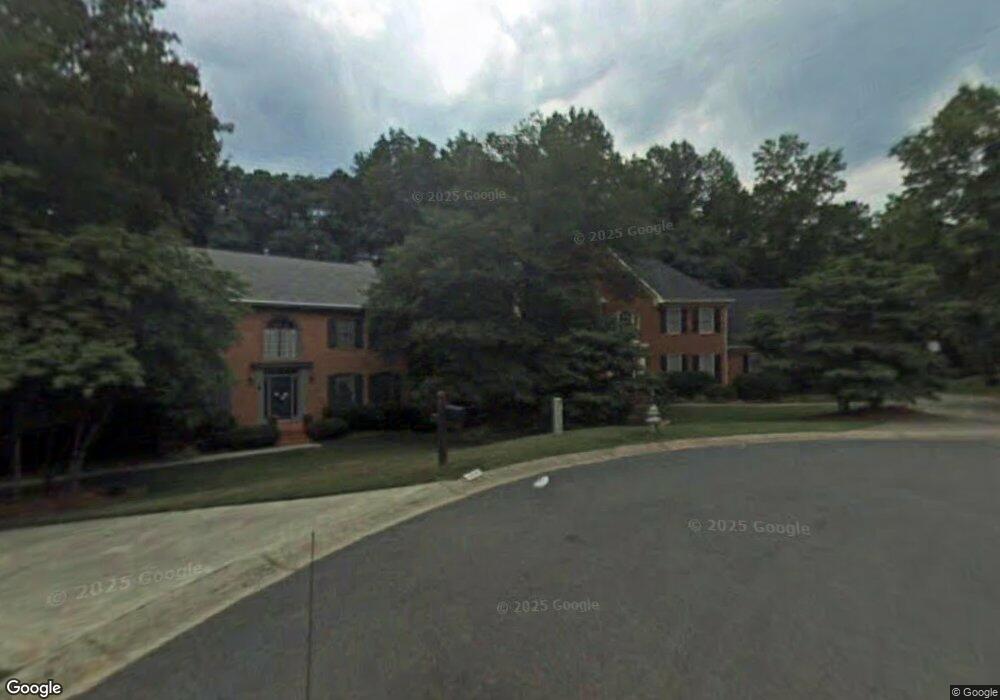
4523 Westcliff Trace NE Unit 2 Roswell, GA 30075
East Cobb NeighborhoodEstimated Value: $757,000 - $824,000
4
Beds
3
Baths
3,164
Sq Ft
$250/Sq Ft
Est. Value
About This Home
This home is located at 4523 Westcliff Trace NE Unit 2, Roswell, GA 30075 and is currently estimated at $790,662, approximately $249 per square foot. 4523 Westcliff Trace NE Unit 2 is a home located in Cobb County with nearby schools including Garrison Mill Elementary School, Mabry Middle School, and Lassiter High School.
Ownership History
Date
Name
Owned For
Owner Type
Purchase Details
Closed on
Oct 31, 2002
Sold by
Prudential Residential Svcs
Bought by
Mccook Anthony E and Mccook Kim S
Current Estimated Value
Home Financials for this Owner
Home Financials are based on the most recent Mortgage that was taken out on this home.
Original Mortgage
$246,500
Outstanding Balance
$101,604
Interest Rate
5.93%
Mortgage Type
New Conventional
Estimated Equity
$689,058
Purchase Details
Closed on
Sep 23, 1999
Sold by
Boden Lawrence D
Bought by
Freithaler Arthur and Freithaler Kim E
Home Financials for this Owner
Home Financials are based on the most recent Mortgage that was taken out on this home.
Original Mortgage
$40,000
Interest Rate
8.22%
Mortgage Type
New Conventional
Purchase Details
Closed on
Sep 29, 1993
Sold by
Stuart David G Sandra B
Bought by
Boden Lawrence D
Home Financials for this Owner
Home Financials are based on the most recent Mortgage that was taken out on this home.
Original Mortgage
$162,000
Interest Rate
6.9%
Create a Home Valuation Report for This Property
The Home Valuation Report is an in-depth analysis detailing your home's value as well as a comparison with similar homes in the area
Home Values in the Area
Average Home Value in this Area
Purchase History
| Date | Buyer | Sale Price | Title Company |
|---|---|---|---|
| Mccook Anthony E | $290,000 | -- | |
| Prudential Residential Svcs | $290,000 | -- | |
| Freithaler Arthur | $289,900 | -- | |
| Boden Lawrence D | $232,000 | -- |
Source: Public Records
Mortgage History
| Date | Status | Borrower | Loan Amount |
|---|---|---|---|
| Open | Prudential Residential Svcs | $246,500 | |
| Previous Owner | Freithaler Arthur | $40,000 | |
| Previous Owner | Boden Lawrence D | $162,000 |
Source: Public Records
Tax History Compared to Growth
Tax History
| Year | Tax Paid | Tax Assessment Tax Assessment Total Assessment is a certain percentage of the fair market value that is determined by local assessors to be the total taxable value of land and additions on the property. | Land | Improvement |
|---|---|---|---|---|
| 2025 | $1,901 | $273,988 | $52,000 | $221,988 |
| 2024 | $1,906 | $273,988 | $52,000 | $221,988 |
| 2023 | $1,700 | $273,988 | $52,000 | $221,988 |
| 2022 | $1,720 | $211,680 | $44,000 | $167,680 |
| 2021 | $1,686 | $200,408 | $44,000 | $156,408 |
| 2020 | $1,686 | $200,408 | $44,000 | $156,408 |
| 2019 | $1,666 | $193,584 | $40,000 | $153,584 |
| 2018 | $5,136 | $193,584 | $40,000 | $153,584 |
| 2017 | $4,714 | $183,444 | $32,000 | $151,444 |
| 2016 | $4,719 | $183,444 | $32,000 | $151,444 |
| 2015 | $4,273 | $158,772 | $42,000 | $116,772 |
| 2014 | $4,306 | $158,772 | $0 | $0 |
Source: Public Records
Map
Nearby Homes
- 4361 Old Mabry Ln NE
- 4363 Old Mabry Rd NE
- 4765 Catoosa Trail NE Unit 2
- 4673 Jefferson Township Place
- 11675 Highland Colony Dr Unit 1
- 4304 Lindsey Way NE
- 4383 Capstone Ct NE
- 4274 Loch Highland Pkwy NE
- 3669 Outlook Ct NE Unit 1
- 4209 Loch Highland Pkwy NE
- 11790 Highland Colony Dr
- 4734 Outlook Way NE
- 4973 Gunners Pass NE
- 11395 West Rd
- 11775 Highland Colony Dr Unit 1
- 4019 Wesley Chapel Rd
- 3870 Sweat Creek Run
- 2000 Trotters Ridge Way Unit 2B
- 4521 Westcliff Trace NE
- 4524 Westcliff Trace NE
- 4119 Springwood Place
- 4519 Westcliff Trace NE
- 4522 Westcliff Trace NE
- 4117 Springwood Place
- 4520 Westcliff Trace NE
- 4515 Westcliff Trace NE
- 4197 Longview Cove NE
- 4120 Springwood Place
- 4398 Bradford Place NE
- 4396 Bradford Place NE
- 4518 Westcliff Trace NE
- 4513 Westcliff Trace NE
- 4115 Springwood Place
- 4118 Springwood Place
- 4195 Longview Cove NE
- 4199 Longview Cove NE
- 4516 Westcliff Trace NE
- 4113 Springwood Place