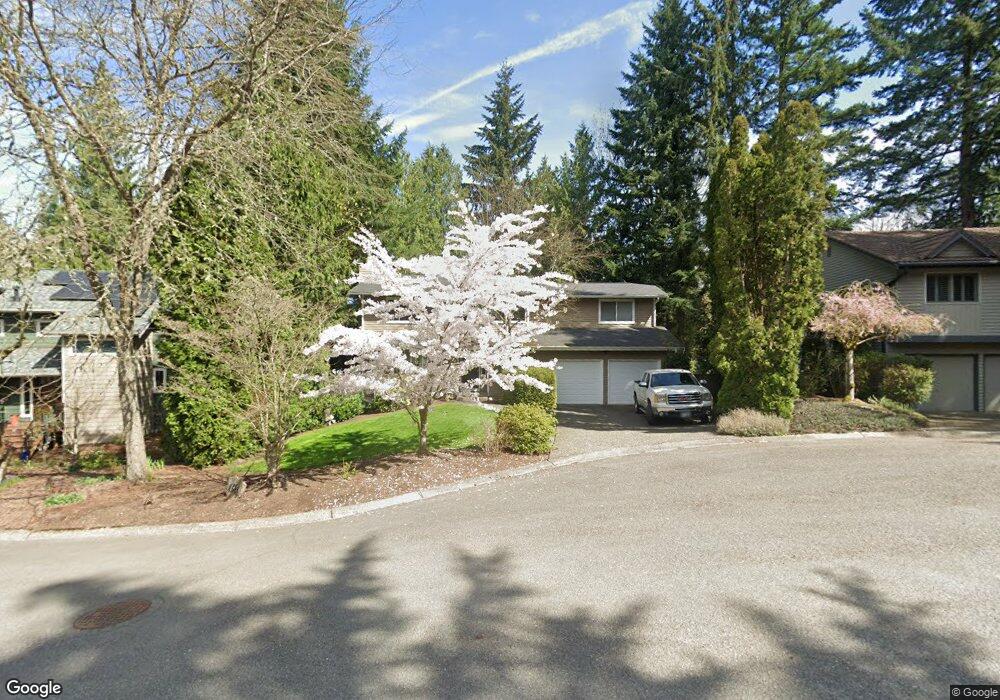
4524 NE 204th Place Lake Forest Park, WA 98155
Horizon View NeighborhoodEstimated Value: $1,034,000 - $1,098,000
4
Beds
3
Baths
2,270
Sq Ft
$469/Sq Ft
Est. Value
About This Home
This home is located at 4524 NE 204th Place, Lake Forest Park, WA 98155 and is currently estimated at $1,063,946, approximately $468 per square foot. 4524 NE 204th Place is a home located in King County with nearby schools including Lake Forest Park Elementary School, Kellogg Middle School, and Shorecrest High School.
Ownership History
Date
Name
Owned For
Owner Type
Purchase Details
Closed on
Jul 28, 2014
Sold by
Bower Robert E and Bower Sue A
Bought by
Robert E Bower Jr & Sue A Bower Trust and Bower Sue A
Current Estimated Value
Purchase Details
Closed on
May 23, 2013
Sold by
Bower Robert E and Bower Sue A
Bought by
Bower Robert E and Bower Sue A
Home Financials for this Owner
Home Financials are based on the most recent Mortgage that was taken out on this home.
Original Mortgage
$321,750
Outstanding Balance
$227,995
Interest Rate
3.48%
Mortgage Type
New Conventional
Estimated Equity
$835,951
Purchase Details
Closed on
Dec 23, 2009
Sold by
Bower Robert E and Bower Sue A
Bought by
Bower Robert E and Bower Sue A
Purchase Details
Closed on
Sep 13, 1989
Sold by
Eggebraaten Glenwood and Eggebraaten Michaela
Bought by
Bower Robert E and Bower Sue A
Create a Home Valuation Report for This Property
The Home Valuation Report is an in-depth analysis detailing your home's value as well as a comparison with similar homes in the area
Home Values in the Area
Average Home Value in this Area
Purchase History
| Date | Buyer | Sale Price | Title Company |
|---|---|---|---|
| Robert E Bower Jr & Sue A Bower Trust | -- | None Available | |
| Bower Robert E | -- | First American | |
| Bower Robert E | -- | None Available | |
| Bower Robert E | $155,000 | -- |
Source: Public Records
Mortgage History
| Date | Status | Borrower | Loan Amount |
|---|---|---|---|
| Open | Bower Robert E | $321,750 |
Source: Public Records
Tax History Compared to Growth
Tax History
| Year | Tax Paid | Tax Assessment Tax Assessment Total Assessment is a certain percentage of the fair market value that is determined by local assessors to be the total taxable value of land and additions on the property. | Land | Improvement |
|---|---|---|---|---|
| 2024 | $9,306 | $925,000 | $409,000 | $516,000 |
| 2023 | $8,689 | $801,000 | $372,000 | $429,000 |
| 2022 | $8,116 | $921,000 | $414,000 | $507,000 |
| 2021 | $7,572 | $732,000 | $324,000 | $408,000 |
| 2020 | $7,454 | $616,000 | $273,000 | $343,000 |
| 2018 | $6,345 | $575,000 | $252,000 | $323,000 |
| 2017 | $5,522 | $528,000 | $232,000 | $296,000 |
| 2016 | $5,465 | $474,000 | $208,000 | $266,000 |
| 2015 | $5,409 | $447,000 | $183,000 | $264,000 |
| 2014 | -- | $419,000 | $171,000 | $248,000 |
| 2013 | -- | $348,000 | $142,000 | $206,000 |
Source: Public Records
Map
Nearby Homes
- 5418 NE 200th Place
- 23726 35th Ave W
- 3730 NE 194th St
- 20317 58th Ln NE
- 24007 44th Ave W
- 19415 36th Ct NE
- 5514 NE 195th St
- 19331 37th Ave NE
- 6042 NE 200th St
- 5531 NE 193rd St
- 19044 35th Ave NE
- 18733 50th Ave NE
- 23325 Cedar Way Unit G105
- 23319 Cedar Way Unit K105
- 24115 22nd Place W
- 3113 232nd St SW
- 23200 29th Ave W
- 23902 48th Ave W
- 23301 Cedar Way Unit U102
- 4902 241st St SW
- 4518 NE 204th Place
- 4530 NE 204th Place
- 4534 NE 204th Place
- 4512 NE 204th Place
- 4523 NE 204th Place
- 4531 NE 204th Place
- 4515 NE 204th Place
- 4538 NE 204th Place
- 20406 45th Ave NE
- 20362 45th Ave NE
- 20325 46th Place NE
- 3424 Alaska Rd
- 3412 Alaska Rd
- 4522 NE 203rd Place
- 4510 NE 203rd Place
- 4530 NE 203rd Place
- 4612 NE 203rd Ct
- 4504 NE 203rd Place
- 20319 46th Place NE
- 4544 NE 203rd Place