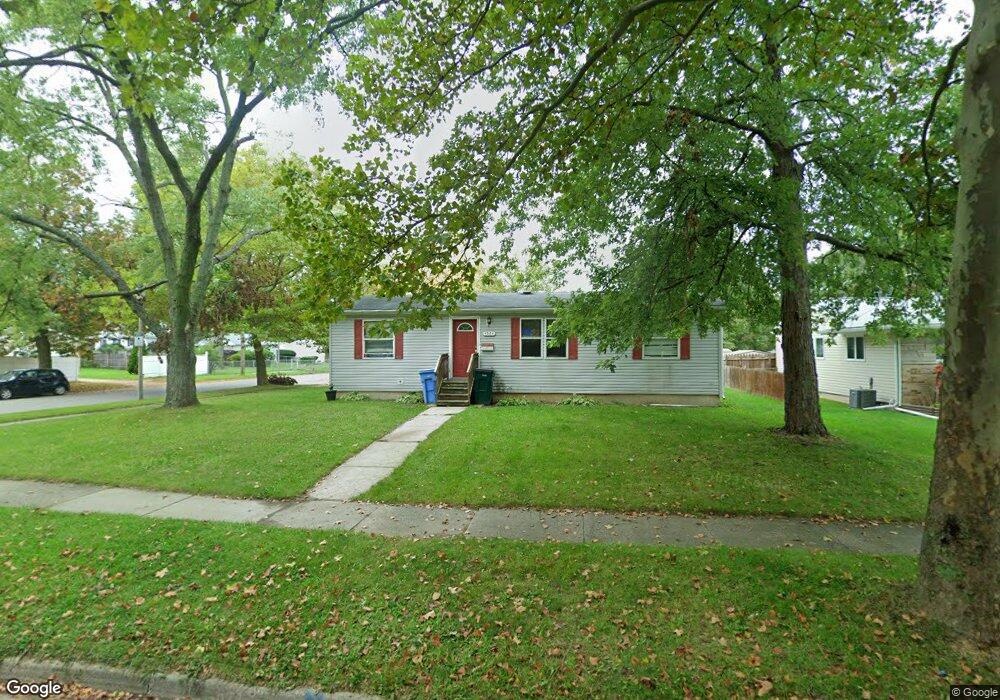
4524 Stillwell Ave Lansing, MI 48911
Churchill Downs NeighborhoodEstimated Value: $145,250 - $179,000
3
Beds
2
Baths
1,144
Sq Ft
$144/Sq Ft
Est. Value
About This Home
This home is located at 4524 Stillwell Ave, Lansing, MI 48911 and is currently estimated at $165,063, approximately $144 per square foot. 4524 Stillwell Ave is a home located in Ingham County with nearby schools including Reo Elementary School, Attwood School, and J.W. Sexton High School.
Ownership History
Date
Name
Owned For
Owner Type
Purchase Details
Closed on
Aug 12, 2013
Sold by
Szemer Noele Ilene and Szemer Noele I
Bought by
Szemer Noele I and Szemer Ted
Current Estimated Value
Home Financials for this Owner
Home Financials are based on the most recent Mortgage that was taken out on this home.
Original Mortgage
$84,722
Outstanding Balance
$65,689
Interest Rate
5.5%
Mortgage Type
FHA
Estimated Equity
$99,375
Purchase Details
Closed on
Dec 31, 2007
Sold by
Rozell James A and Ibarra Rozell Maria D
Bought by
Szemer Noele Ilene and Szemer Ted
Home Financials for this Owner
Home Financials are based on the most recent Mortgage that was taken out on this home.
Original Mortgage
$90,286
Interest Rate
6.17%
Mortgage Type
FHA
Purchase Details
Closed on
Dec 28, 2007
Sold by
Hagan Kelly M
Bought by
Szemer Ted and Szemer Noele I
Home Financials for this Owner
Home Financials are based on the most recent Mortgage that was taken out on this home.
Original Mortgage
$90,286
Interest Rate
6.17%
Mortgage Type
FHA
Purchase Details
Closed on
Nov 20, 2003
Sold by
Department Of Natural Resources
Bought by
Rozell James A
Create a Home Valuation Report for This Property
The Home Valuation Report is an in-depth analysis detailing your home's value as well as a comparison with similar homes in the area
Home Values in the Area
Average Home Value in this Area
Purchase History
| Date | Buyer | Sale Price | Title Company |
|---|---|---|---|
| Szemer Noele I | -- | None Available | |
| Szemer Noele Ilene | $91,000 | None Available | |
| Szemer Ted | -- | None Available | |
| Rozell James A | $8,450 | -- |
Source: Public Records
Mortgage History
| Date | Status | Borrower | Loan Amount |
|---|---|---|---|
| Open | Szemer Noele I | $84,722 | |
| Closed | Szemer Noele Ilene | $90,286 |
Source: Public Records
Tax History Compared to Growth
Tax History
| Year | Tax Paid | Tax Assessment Tax Assessment Total Assessment is a certain percentage of the fair market value that is determined by local assessors to be the total taxable value of land and additions on the property. | Land | Improvement |
|---|---|---|---|---|
| 2025 | $2,828 | $65,900 | $10,500 | $55,400 |
| 2024 | $22 | $61,800 | $10,500 | $51,300 |
| 2023 | $2,652 | $55,100 | $10,500 | $44,600 |
| 2022 | $2,392 | $49,100 | $10,500 | $38,600 |
| 2021 | $2,342 | $48,800 | $6,700 | $42,100 |
| 2020 | $2,327 | $45,100 | $6,700 | $38,400 |
| 2019 | $2,231 | $43,400 | $6,700 | $36,700 |
| 2018 | $2,127 | $38,300 | $6,700 | $31,600 |
| 2017 | $2,039 | $38,300 | $6,700 | $31,600 |
| 2016 | $1,955 | $35,600 | $6,700 | $28,900 |
| 2015 | $1,955 | $34,400 | $13,357 | $21,043 |
| 2014 | $1,955 | $33,800 | $21,090 | $12,710 |
Source: Public Records
Map
Nearby Homes
- 4709 Stillwell Ave
- 3115 Risdale Ave
- 3523 Lucie St
- 5100 Wexford Rd
- 3941 Glenburne Blvd
- 4809 Ballard Rd
- 3818 Churchill Ave
- 3814 Wedgewood Dr
- 4400 Chadburne Dr
- 4009 Heathgate Dr
- 4828 Ingham St
- 2816 Greenbelt Dr
- 3006 Hillcrest St
- 5200 Wise Rd
- 2804 Midwood St
- 4107 Windward Dr
- 3100 Glenbrook Dr
- 4317 Seaway Dr
- 3424 S Catherine St
- 4205 Glenburne Blvd
- 4514 Stillwell Ave
- 3424 Ronald St
- 4508 Stillwell Ave
- 4600 Stillwell Ave
- 3430 Ronald St
- 4521 Stillwell Ave
- 3425 Jerree St
- 4515 Stillwell Ave
- 4500 Stillwell Ave
- 4610 Stillwell Ave
- 3431 Jerree St
- 4509 Stillwell Ave
- 3500 Ronald St
- 4601 Stillwell Ave
- 3420 Maybel St
- 3431 Ronald St
- 4501 Stillwell Ave
- 3501 Jerree St
- 3320 Ronald St
- 4616 Stillwell Ave