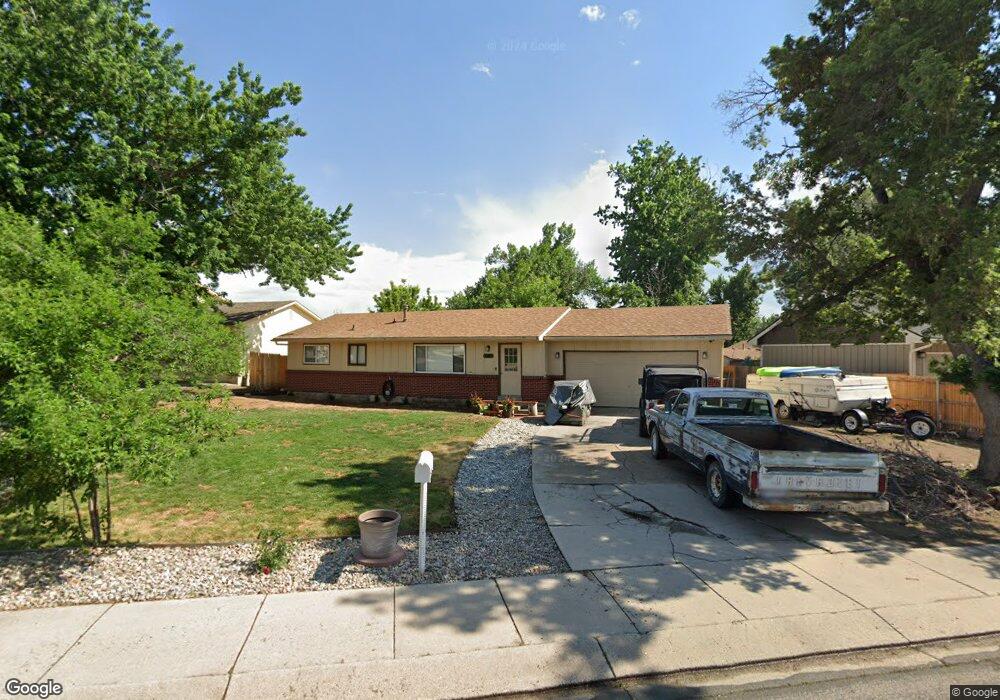
4525 Misty Dr Colorado Springs, CO 80918
Garden Ranch NeighborhoodEstimated Value: $401,855 - $450,000
4
Beds
1
Bath
1,041
Sq Ft
$411/Sq Ft
Est. Value
About This Home
This home is located at 4525 Misty Dr, Colorado Springs, CO 80918 and is currently estimated at $427,964, approximately $411 per square foot. 4525 Misty Dr is a home located in El Paso County with nearby schools including Grant Elementary School, Mann Middle School, and Mitchell High School.
Ownership History
Date
Name
Owned For
Owner Type
Purchase Details
Closed on
Mar 19, 2020
Sold by
Cunha Ryan J
Bought by
Myrick Kaile and Myrick Cambria
Current Estimated Value
Home Financials for this Owner
Home Financials are based on the most recent Mortgage that was taken out on this home.
Original Mortgage
$239,999
Outstanding Balance
$212,148
Interest Rate
3.4%
Mortgage Type
New Conventional
Estimated Equity
$215,816
Purchase Details
Closed on
Jul 28, 2016
Sold by
Bernard Marc
Bought by
Cunha Ryan J
Home Financials for this Owner
Home Financials are based on the most recent Mortgage that was taken out on this home.
Original Mortgage
$120,941
Interest Rate
3.48%
Mortgage Type
Purchase Money Mortgage
Purchase Details
Closed on
May 25, 2016
Sold by
Bernard Marc
Bought by
Bernard Marc
Purchase Details
Closed on
Aug 1, 1979
Bought by
Cunha Ryan J
Create a Home Valuation Report for This Property
The Home Valuation Report is an in-depth analysis detailing your home's value as well as a comparison with similar homes in the area
Home Values in the Area
Average Home Value in this Area
Purchase History
| Date | Buyer | Sale Price | Title Company |
|---|---|---|---|
| Myrick Kaile | $299,999 | Unified Title Co | |
| Cunha Ryan J | $160,000 | Empire Title Colorago Spring | |
| Bernard Marc | -- | None Available | |
| Cunha Ryan J | -- | -- |
Source: Public Records
Mortgage History
| Date | Status | Borrower | Loan Amount |
|---|---|---|---|
| Open | Myrick Kaile | $239,999 | |
| Previous Owner | Cunha Ryan J | $120,941 |
Source: Public Records
Tax History Compared to Growth
Tax History
| Year | Tax Paid | Tax Assessment Tax Assessment Total Assessment is a certain percentage of the fair market value that is determined by local assessors to be the total taxable value of land and additions on the property. | Land | Improvement |
|---|---|---|---|---|
| 2025 | $1,302 | $28,590 | -- | -- |
| 2024 | $1,190 | $27,840 | $4,820 | $23,020 |
| 2022 | $1,109 | $19,810 | $3,610 | $16,200 |
| 2021 | $1,203 | $20,390 | $3,720 | $16,670 |
| 2020 | $1,174 | $17,300 | $3,220 | $14,080 |
| 2019 | $1,168 | $17,300 | $3,220 | $14,080 |
| 2018 | $1,032 | $14,060 | $2,160 | $11,900 |
| 2017 | $977 | $14,060 | $2,160 | $11,900 |
| 2016 | $799 | $13,780 | $2,230 | $11,550 |
| 2015 | $796 | $13,780 | $2,230 | $11,550 |
| 2014 | $747 | $12,420 | $2,230 | $10,190 |
Source: Public Records
Map
Nearby Homes
- 4518 Misty Dr
- 4434 Misty Dr
- 4410 Moonlight Dr
- 4454 Ranch Cir
- 2832 Ridgeglen Way
- 4858 Sonata Dr Unit D
- 4886 Sonata Dr Unit C
- 4853 Sonata Dr Unit C
- 4742 Villa Cir Unit A
- 5030 El Camino Dr Unit 8
- 5030 El Camino Dr Unit 1
- 4911 Sonata Dr
- 5034 El Camino Dr Unit 36
- 5034 El Camino Dr Unit 31
- 5034 El Camino Dr Unit 42
- 3710 Windflower Cir
- 4623 Ranch Cir
- 4806 Sprucewood Dr
- 5015 Bonita Way
- 872 Naismith Ln
- 4523 Misty Dr
- 4529 Misty Dr
- 3102 Shadowglen Way
- 3106 Shadowglen Way
- 4519 Misty Dr
- 4533 Misty Dr
- 4526 Misty Dr
- 4528 Misty Dr
- 4522 Misty Dr
- 4608 Shadowglen Dr
- 3103 Shadowglen Way
- 4603 Misty Dr
- 4532 Misty Dr
- 4511 Misty Dr
- 3114 Shadowglen Way
- 4612 Shadowglen Dr
- 4602 Misty Dr
- 3107 Shadowglen Way
- 4616 Shadowglen Dr
- 4507 Misty Dr