Estimated Value: $404,276 - $450,000
4
Beds
2
Baths
2,048
Sq Ft
$210/Sq Ft
Est. Value
About This Home
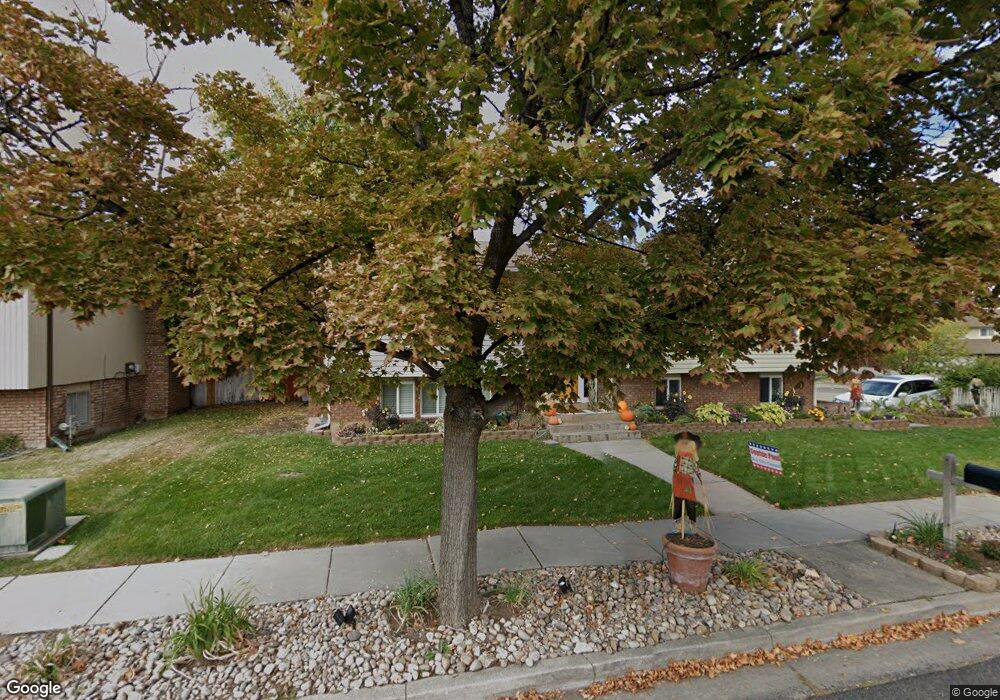
This home is located at 4525 S 1600 W, Roy, UT 84067 and is currently estimated at $429,319, approximately $209 per square foot. 4525 S 1600 W is a home located in Weber County with nearby schools including Valley View School, Sand Ridge Junior High School, and Roy High School.
Ownership History
Date
Name
Owned For
Owner Type
Purchase Details
Closed on
Oct 15, 2003
Sold by
All Star Financial Services Llc
Bought by
Nebeker Kyle Robert and Nebeker Misti Francis
Current Estimated Value
Home Financials for this Owner
Home Financials are based on the most recent Mortgage that was taken out on this home.
Original Mortgage
$115,192
Outstanding Balance
$54,455
Interest Rate
6.4%
Mortgage Type
FHA
Estimated Equity
$374,864
Purchase Details
Closed on
May 20, 1996
Sold by
Fielding Steven R and Fielding Joanne S
Bought by
Fisher C Michael and Fisher Venessa R
Home Financials for this Owner
Home Financials are based on the most recent Mortgage that was taken out on this home.
Original Mortgage
$88,880
Interest Rate
6%
Create a Home Valuation Report for This Property
The Home Valuation Report is an in-depth analysis detailing your home's value as well as a comparison with similar homes in the area
Home Values in the Area
Average Home Value in this Area
Purchase History
| Date | Buyer | Sale Price | Title Company |
|---|---|---|---|
| Nebeker Kyle Robert | -- | Mountain View Title | |
| Fisher C Michael | -- | Equity Title |
Source: Public Records
Mortgage History
| Date | Status | Borrower | Loan Amount |
|---|---|---|---|
| Open | Nebeker Kyle Robert | $115,192 | |
| Previous Owner | Fisher C Michael | $88,880 |
Source: Public Records
Tax History
| Year | Tax Paid | Tax Assessment Tax Assessment Total Assessment is a certain percentage of the fair market value that is determined by local assessors to be the total taxable value of land and additions on the property. | Land | Improvement |
|---|---|---|---|---|
| 2025 | $2,394 | $375,577 | $146,349 | $229,228 |
| 2024 | $2,341 | $370,000 | $146,363 | $223,637 |
| 2023 | $2,262 | $358,000 | $143,285 | $214,715 |
| 2022 | $2,137 | $346,000 | $114,788 | $231,212 |
| 2021 | $1,853 | $272,000 | $81,165 | $190,835 |
| 2020 | $1,762 | $238,000 | $81,165 | $156,835 |
| 2019 | $1,820 | $233,000 | $46,867 | $186,133 |
| 2018 | $1,692 | $203,000 | $42,055 | $160,945 |
| 2017 | $1,572 | $176,000 | $42,055 | $133,945 |
| 2016 | $1,499 | $90,056 | $23,556 | $66,500 |
| 2015 | $1,388 | $85,127 | $20,910 | $64,217 |
| 2014 | $1,301 | $78,157 | $20,910 | $57,247 |
Source: Public Records
Map
Nearby Homes
- 1639 W 4575 S
- 4598 S Blossom Glen Way
- 4602 Hathaway Dr
- 4539 S 1800 W Unit 127
- 1198 W 4400 S Unit V
- 1198 W 4400 S Unit T
- 2015 W 4450 S
- 1838 W 5050 S
- 1818 W 5050 S
- 4697 S 2025 W
- 1805 W 5050 S
- 1781 W 5050 S
- 1789 W 5050 S
- 5092 S 1800 W
- 2015 W 4225 S
- 4256 S 1100 W
- 5124 S 1275 W
- 5131 S 1275 W
- 5125 S 1250 W
- 1075 W 4175 S
Your Personal Tour Guide
Ask me questions while you tour the home.