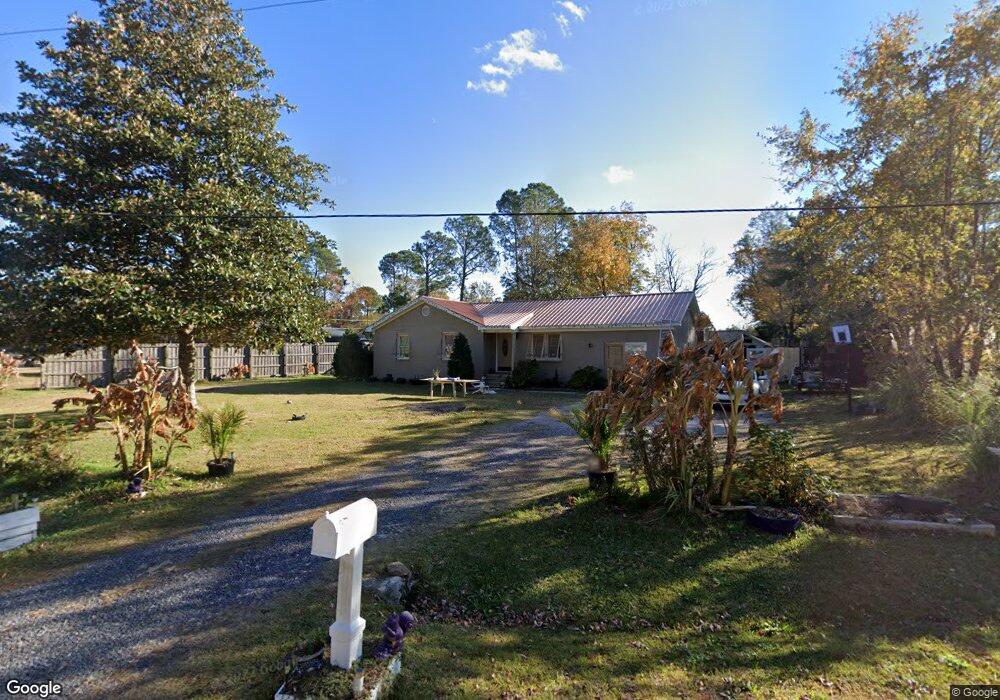
4526 Middlesex Rd Wilmington, NC 28405
Estimated Value: $304,000 - $364,000
3
Beds
2
Baths
1,450
Sq Ft
$235/Sq Ft
Est. Value
About This Home
This home is located at 4526 Middlesex Rd, Wilmington, NC 28405 and is currently estimated at $340,987, approximately $235 per square foot. 4526 Middlesex Rd is a home located in New Hanover County with nearby schools including Wrightsboro Elementary School, Holly Shelter Middle School, and Emsley A. Laney High School.
Ownership History
Date
Name
Owned For
Owner Type
Purchase Details
Closed on
Jan 12, 2007
Sold by
Swanson Robert L and Swanson Linda L
Bought by
Kamm Justin
Current Estimated Value
Home Financials for this Owner
Home Financials are based on the most recent Mortgage that was taken out on this home.
Original Mortgage
$139,500
Outstanding Balance
$82,620
Interest Rate
6.05%
Mortgage Type
Purchase Money Mortgage
Estimated Equity
$258,367
Purchase Details
Closed on
Nov 14, 2003
Sold by
Coastal Home Buyers Ltd
Bought by
Swanson Robert L Linda
Purchase Details
Closed on
Mar 6, 2003
Sold by
David Delores L
Bought by
Coastal Home Buyers Ltd
Purchase Details
Closed on
Oct 21, 1999
Sold by
Davis Howard F
Bought by
Davis Delores L
Purchase Details
Closed on
Aug 1, 1981
Sold by
Cain Jerry Reece Linda K
Bought by
Davis Howard F Delores L
Purchase Details
Closed on
Jan 1, 1976
Bought by
Cain Jerry Reece Linda K
Create a Home Valuation Report for This Property
The Home Valuation Report is an in-depth analysis detailing your home's value as well as a comparison with similar homes in the area
Home Values in the Area
Average Home Value in this Area
Purchase History
| Date | Buyer | Sale Price | Title Company |
|---|---|---|---|
| Kamm Justin | $155,000 | None Available | |
| Swanson Robert L Linda | -- | -- | |
| Coastal Home Buyers Ltd | $59,000 | -- | |
| Coastal Home Buyers Ltd | -- | -- | |
| Davis Delores L | -- | -- | |
| Davis Howard F Delores L | $47,000 | -- | |
| Cain Jerry Reece Linda K | $28,900 | -- |
Source: Public Records
Mortgage History
| Date | Status | Borrower | Loan Amount |
|---|---|---|---|
| Open | Kamm Justin | $139,500 |
Source: Public Records
Tax History Compared to Growth
Tax History
| Year | Tax Paid | Tax Assessment Tax Assessment Total Assessment is a certain percentage of the fair market value that is determined by local assessors to be the total taxable value of land and additions on the property. | Land | Improvement |
|---|---|---|---|---|
| 2025 | $1,226 | $352,300 | $136,800 | $215,500 |
| 2023 | $1,226 | $220,500 | $80,600 | $139,900 |
| 2022 | $1,231 | $220,500 | $80,600 | $139,900 |
| 2021 | $1,219 | $220,500 | $80,600 | $139,900 |
| 2020 | $970 | $153,400 | $47,300 | $106,100 |
| 2019 | $970 | $153,400 | $47,300 | $106,100 |
| 2018 | $970 | $153,400 | $47,300 | $106,100 |
| 2017 | $993 | $153,400 | $47,300 | $106,100 |
| 2016 | $850 | $122,600 | $40,500 | $82,100 |
| 2015 | $790 | $122,600 | $40,500 | $82,100 |
| 2014 | $776 | $122,600 | $40,500 | $82,100 |
Source: Public Records
Map
Nearby Homes
- 4625 Manchester Dr
- 710 Cheryl Ln
- 807 Cheryl Ln
- 4509 Dullage Dr
- 635 N College Rd
- 4427 Deborah Ct
- 4335 Reed Ct
- 106 Ray Dr
- 715 Clearwater Ct Unit A
- 713 Clearwater Ct Unit A
- 902 Litchfield Way Unit K
- 909 Litchfield Way Unit B
- 904 Litchfield Way
- 803 Bryce Ct Unit H
- 719 Melba Ct Unit I
- 719 Grathwol Dr
- 1013 Glenlea Dr
- 5122 Hunters Trail
- 4140 Lockwood Dr
- 413 Rolling Rd
- 4602 Manchester Dr
- 4522 Middlesex Rd
- 4606 Manchester Dr
- 4518 Middlesex Rd
- 4601 Terry Ln
- 4601 Manchester Dr
- 4521 Terry Ln
- 4521 Middlesex Rd
- 4605 Terry Ln
- 4605 Manchester Dr
- 4529 Middlesex Rd
- 4610 Manchester Dr
- 4517 Terry Ln
- 4514 Middlesex Rd
- 4609 Manchester Dr
- 4609 Terry Ln
- 4513 Middlesex Rd
- 4513 Terry Ln
- 4602 Bramton Rd
- 4533 Middlesex Rd