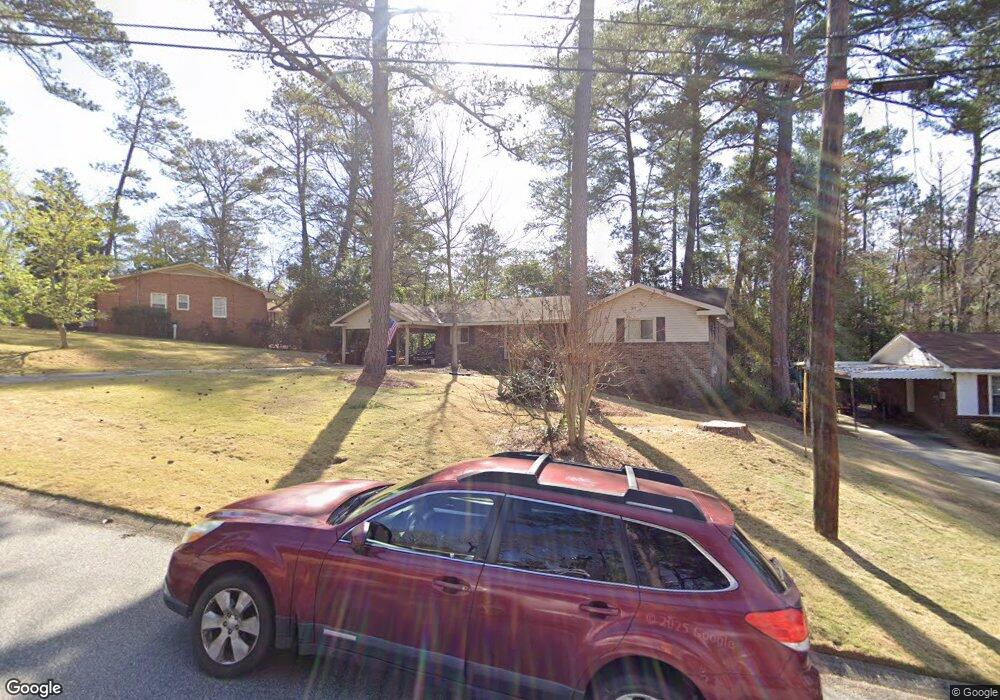
4526 Nan Leah Ln Columbus, GA 31909
Northern Columbus NeighborhoodEstimated Value: $198,000 - $241,000
3
Beds
3
Baths
1,664
Sq Ft
$131/Sq Ft
Est. Value
About This Home
This home is located at 4526 Nan Leah Ln, Columbus, GA 31909 and is currently estimated at $217,516, approximately $130 per square foot. 4526 Nan Leah Ln is a home located in Muscogee County with nearby schools including Blanchard Elementary School, Blackmon Road Middle School, and Hardaway High School.
Ownership History
Date
Name
Owned For
Owner Type
Purchase Details
Closed on
Apr 11, 2025
Sold by
Karastury Frank P
Bought by
Karastury Frank Paul
Current Estimated Value
Purchase Details
Closed on
Nov 11, 2008
Sold by
Karastury Brenda C
Bought by
Karastury Frank P
Purchase Details
Closed on
Oct 16, 2007
Sold by
Karastury Frank P
Bought by
Karastury Brenda C
Purchase Details
Closed on
Jul 18, 2007
Sold by
Rinder Linda C and Rinder John T
Bought by
Karastury Frank P and Karastury Brenda C
Home Financials for this Owner
Home Financials are based on the most recent Mortgage that was taken out on this home.
Original Mortgage
$109,500
Interest Rate
6.52%
Mortgage Type
Purchase Money Mortgage
Purchase Details
Closed on
Feb 26, 2007
Sold by
Rinder Linda C and Catrett Linda G
Bought by
Rinder Linda C and Rinder John T
Home Financials for this Owner
Home Financials are based on the most recent Mortgage that was taken out on this home.
Original Mortgage
$137,500
Interest Rate
6.16%
Mortgage Type
Purchase Money Mortgage
Create a Home Valuation Report for This Property
The Home Valuation Report is an in-depth analysis detailing your home's value as well as a comparison with similar homes in the area
Home Values in the Area
Average Home Value in this Area
Purchase History
| Date | Buyer | Sale Price | Title Company |
|---|---|---|---|
| Karastury Frank Paul | -- | None Listed On Document | |
| Karastury Frank P | -- | None Available | |
| Karastury Brenda C | $2,000 | None Available | |
| Karastury Frank P | $149,500 | None Available | |
| Rinder Linda C | -- | None Available |
Source: Public Records
Mortgage History
| Date | Status | Borrower | Loan Amount |
|---|---|---|---|
| Previous Owner | Karastury Frank P | $109,500 | |
| Previous Owner | Rinder Linda C | $137,500 |
Source: Public Records
Tax History Compared to Growth
Tax History
| Year | Tax Paid | Tax Assessment Tax Assessment Total Assessment is a certain percentage of the fair market value that is determined by local assessors to be the total taxable value of land and additions on the property. | Land | Improvement |
|---|---|---|---|---|
| 2025 | $1,818 | $62,324 | $8,172 | $54,152 |
| 2024 | $1,817 | $62,324 | $8,172 | $54,152 |
| 2023 | $113 | $62,324 | $8,172 | $54,152 |
| 2022 | $1,894 | $51,784 | $8,172 | $43,612 |
| 2021 | $1,888 | $44,916 | $8,172 | $36,744 |
| 2020 | $1,888 | $44,916 | $8,172 | $36,744 |
| 2019 | $1,896 | $44,916 | $8,172 | $36,744 |
| 2018 | $1,896 | $44,916 | $8,172 | $36,744 |
| 2017 | $1,904 | $44,916 | $8,172 | $36,744 |
| 2016 | $1,912 | $59,622 | $6,364 | $53,258 |
| 2015 | $1,915 | $59,622 | $6,364 | $53,258 |
| 2014 | $1,918 | $59,622 | $6,364 | $53,258 |
| 2013 | -- | $59,622 | $6,364 | $53,258 |
Source: Public Records
Map
Nearby Homes
- 6136 Morningside Dr
- 4627 Wimbish Ct
- 6500 Charter Oaks Cir
- 4454 Weems Rd
- 6158 Arrington Dr
- 4245 N Oaks Dr
- 4417 Sibley St
- 5011 Montego Dr
- 5042 Foxfire Dr
- 5041 Montego Dr
- 4715 Teak Dr
- 5045 Old Post Rd
- 6630 Lemans Ln
- 4320 Canady St
- 6137 Stoneway Dr
- 5028 Warm Springs Rd
- 5926 Frazier Dr
- 6717 Moon Cir
- 4847 Warm Springs Rd
- 5915 Frazier Dr
- 4520 Nan Leah Ln
- 4536 Nan Leah Ln
- 6250 Jane Ln
- 4514 Nan Leah Ln
- 4519 Nan Leah Ln
- 4552 Nan Leah Ln
- 4511 Nan Leah Ln
- 4535 Nan Leah Ln
- 4537 Nan Leah Ln
- 6308 Jane Ln
- 4560 Nan Leah Ln
- 4538 Ritch Haven Rd
- 4554 Ritch Haven Rd
- 4530 Ritch Haven Rd
- 4546 Ritch Haven Rd
- 4560 Ritch Haven Rd
- 4514 Ritch Haven Rd
- 6307 Jane Ln
- 6305 Jane Ln
- 6317 Jane Ln