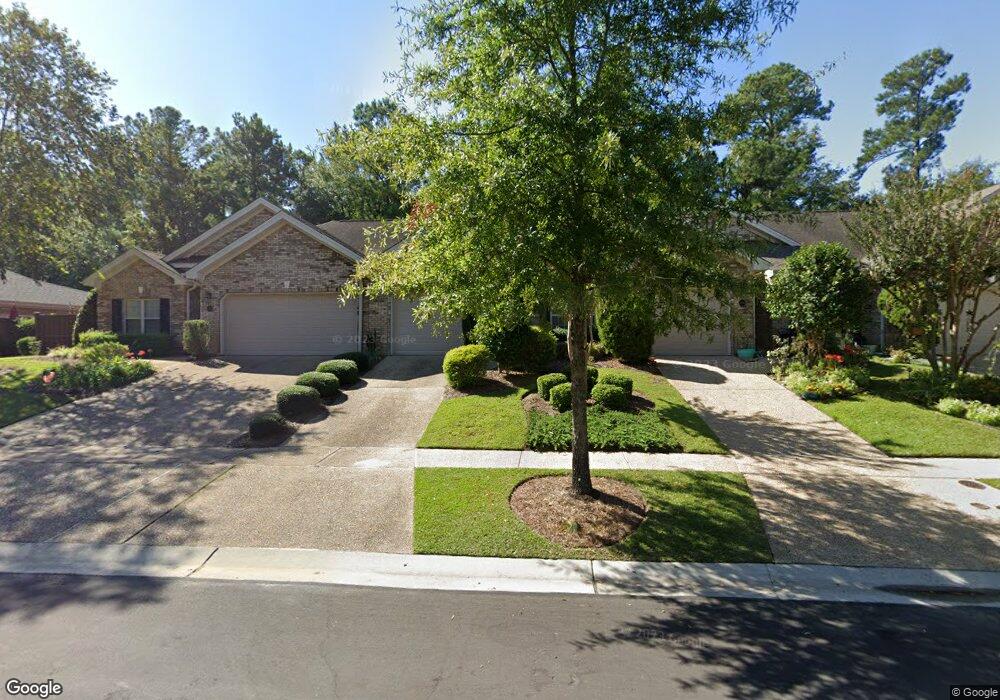
4526 Regent Dr Wilmington, NC 28412
Carriage Hills NeighborhoodEstimated Value: $338,574 - $384,000
2
Beds
2
Baths
1,323
Sq Ft
$268/Sq Ft
Est. Value
About This Home
This home is located at 4526 Regent Dr, Wilmington, NC 28412 and is currently estimated at $354,644, approximately $268 per square foot. 4526 Regent Dr is a home located in New Hanover County with nearby schools including Pine Valley Elementary School, Williston Middle School, and Eugene Ashley High School.
Ownership History
Date
Name
Owned For
Owner Type
Purchase Details
Closed on
Jul 19, 2011
Sold by
Dawson John C S
Bought by
Dawson Sandra L
Current Estimated Value
Purchase Details
Closed on
Sep 26, 2005
Sold by
Steinberg David Joseph and Weinbach Robert
Bought by
Dawson Sandra L and Dawson John C S
Home Financials for this Owner
Home Financials are based on the most recent Mortgage that was taken out on this home.
Original Mortgage
$184,500
Outstanding Balance
$94,958
Interest Rate
5.25%
Mortgage Type
Purchase Money Mortgage
Estimated Equity
$259,686
Purchase Details
Closed on
Jul 21, 2004
Sold by
Eastland Developers Inc
Bought by
Steinberg David Joseph
Purchase Details
Closed on
Apr 21, 2004
Sold by
Olde Point Llc
Bought by
Eastland Developers Inc
Purchase Details
Closed on
Dec 13, 2002
Sold by
Efird Jr Claude L
Bought by
Olde Point Llc
Create a Home Valuation Report for This Property
The Home Valuation Report is an in-depth analysis detailing your home's value as well as a comparison with similar homes in the area
Home Values in the Area
Average Home Value in this Area
Purchase History
| Date | Buyer | Sale Price | Title Company |
|---|---|---|---|
| Dawson Sandra L | -- | None Available | |
| Dawson Sandra L | $205,000 | None Available | |
| Steinberg David Joseph | $138,500 | -- | |
| Eastland Developers Inc | -- | -- | |
| Olde Point Llc | $1,710,500 | -- |
Source: Public Records
Mortgage History
| Date | Status | Borrower | Loan Amount |
|---|---|---|---|
| Open | Dawson Sandra L | $184,500 |
Source: Public Records
Tax History Compared to Growth
Tax History
| Year | Tax Paid | Tax Assessment Tax Assessment Total Assessment is a certain percentage of the fair market value that is determined by local assessors to be the total taxable value of land and additions on the property. | Land | Improvement |
|---|---|---|---|---|
| 2025 | $1,913 | $322,800 | $50,000 | $272,800 |
| 2023 | $1,913 | $219,900 | $50,000 | $169,900 |
| 2022 | $1,869 | $219,900 | $50,000 | $169,900 |
| 2021 | $1,882 | $219,900 | $50,000 | $169,900 |
| 2020 | $1,833 | $174,000 | $35,000 | $139,000 |
| 2019 | $1,833 | $174,000 | $35,000 | $139,000 |
| 2018 | $1,833 | $174,000 | $35,000 | $139,000 |
| 2017 | $1,833 | $174,000 | $35,000 | $139,000 |
| 2016 | $1,600 | $144,400 | $29,800 | $114,600 |
| 2015 | $1,529 | $144,400 | $29,800 | $114,600 |
| 2014 | $1,464 | $144,400 | $29,800 | $114,600 |
Source: Public Records
Map
Nearby Homes
- 4538 Regent Dr
- 1106 Groppo Cove
- 1103 Groppo Cove
- 905 Haymarket Ln
- 4432 Regent Dr
- 4422 Grey Oaks Ct
- 4426 Quail Ct
- 4414 Grey Oaks Ct
- 801 Saint Andrews Dr
- 4325 Appleton Way
- 3809 Habberline St
- 1207 Matteo Dr
- 4217 Ashley Park Dr
- 1035 Avenshire Cir
- 1114 Mccarley Blvd
- 4001 E Durant Ct
- 912 Taliga Ln
- 3520 Daufuskie Dr
- 3536 Daufuskie Dr
- 3540 Daufuskie Dr