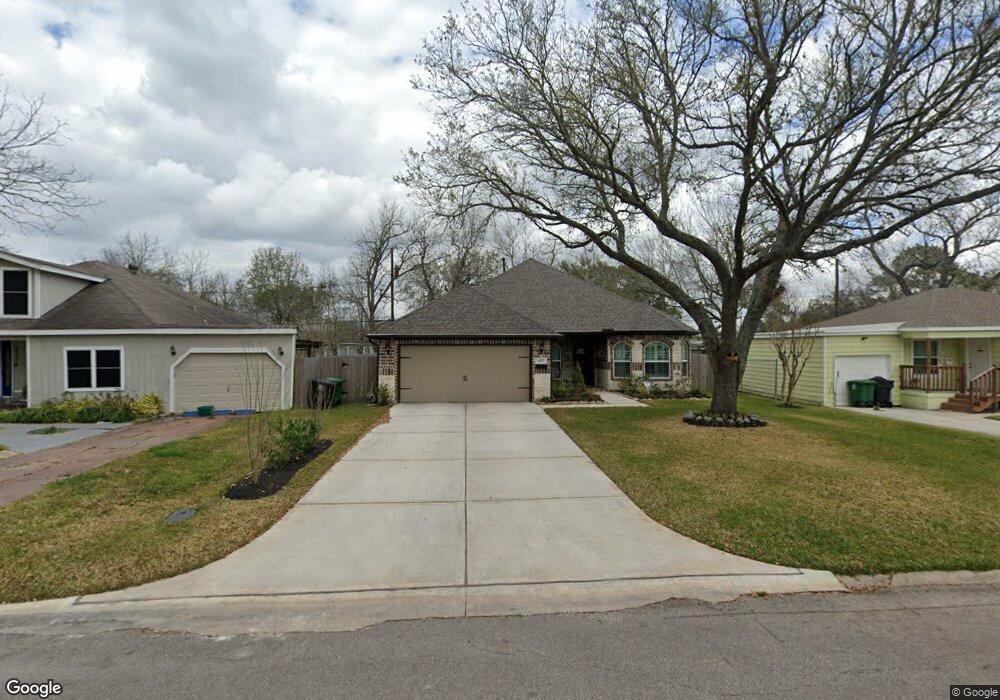
4527 Keystone St Houston, TX 77021
OST-South Union NeighborhoodEstimated Value: $278,000 - $311,000
3
Beds
3
Baths
1,627
Sq Ft
$186/Sq Ft
Est. Value
About This Home
This home is located at 4527 Keystone St, Houston, TX 77021 and is currently estimated at $301,845, approximately $185 per square foot. 4527 Keystone St is a home located in Harris County with nearby schools including Peck Elementary School, Cullen Middle School, and Yates High School.
Ownership History
Date
Name
Owned For
Owner Type
Purchase Details
Closed on
Feb 10, 2021
Sold by
Mabyberry Homes
Bought by
Grace Julie A
Current Estimated Value
Home Financials for this Owner
Home Financials are based on the most recent Mortgage that was taken out on this home.
Original Mortgage
$233,850
Outstanding Balance
$170,948
Interest Rate
2.7%
Mortgage Type
New Conventional
Estimated Equity
$130,897
Purchase Details
Closed on
Aug 4, 2020
Sold by
Grace Julie
Bought by
Mayberry Homes Inc
Purchase Details
Closed on
Aug 4, 2017
Sold by
Grace Julie A
Bought by
Grace Julir A
Home Financials for this Owner
Home Financials are based on the most recent Mortgage that was taken out on this home.
Original Mortgage
$50,000
Interest Rate
3.96%
Mortgage Type
Stand Alone Second
Purchase Details
Closed on
Mar 14, 2001
Sold by
Grace Rosa Thierry and Grace Rosalie
Bought by
Grace Julie
Purchase Details
Closed on
Aug 4, 1995
Sold by
Grace Eddie B
Bought by
Grace Rosalie Lee
Create a Home Valuation Report for This Property
The Home Valuation Report is an in-depth analysis detailing your home's value as well as a comparison with similar homes in the area
Home Values in the Area
Average Home Value in this Area
Purchase History
| Date | Buyer | Sale Price | Title Company |
|---|---|---|---|
| Grace Julie A | -- | Transact Title | |
| Mayberry Homes Inc | -- | Transact Title | |
| Grace Julir A | -- | None Available | |
| Grace Julie | -- | -- | |
| Grace Rosalie Lee | -- | -- |
Source: Public Records
Mortgage History
| Date | Status | Borrower | Loan Amount |
|---|---|---|---|
| Open | Grace Julie A | $233,850 | |
| Previous Owner | Grace Julir A | $50,000 |
Source: Public Records
Tax History Compared to Growth
Tax History
| Year | Tax Paid | Tax Assessment Tax Assessment Total Assessment is a certain percentage of the fair market value that is determined by local assessors to be the total taxable value of land and additions on the property. | Land | Improvement |
|---|---|---|---|---|
| 2025 | $840 | $319,631 | $106,021 | $213,610 |
| 2024 | $840 | $339,128 | $106,021 | $233,107 |
| 2023 | $840 | $336,957 | $96,666 | $240,291 |
| 2022 | $5,478 | $280,570 | $87,311 | $193,259 |
| 2021 | $3,265 | $140,098 | $53,010 | $87,088 |
| 2020 | $1,711 | $70,663 | $34,301 | $36,362 |
| 2019 | $1,401 | $55,348 | $34,301 | $21,047 |
| 2018 | $1,363 | $53,852 | $28,064 | $25,788 |
| 2017 | $1,362 | $53,852 | $28,064 | $25,788 |
| 2016 | $1,362 | $53,852 | $28,064 | $25,788 |
| 2015 | $1,135 | $53,852 | $28,064 | $25,788 |
| 2014 | $1,135 | $44,146 | $15,591 | $28,555 |
Source: Public Records
Map
Nearby Homes
- 4523 Keystone St
- 4522 Dixie Dr
- 4603 Keystone St
- 4604 Keystone St
- 4522 Dewberry St
- 4504 Kingsbury St
- 4613 Dewberry St
- 6919 Calhoun Rd
- 4509 Perry St
- 6302 Calhoun Rd
- 0 New York St
- 4516 Perry St
- 4624 Kingsbury St
- 0 London St
- 6309 Calhoun Rd
- 6320 Paris St
- 6326 Calhoun Rd
- 7131 Cullen Blvd
- 5738 Cullen Blvd
- 6325 Cullen Blvd
- 4525 Keystone St
- 4529 Keystone St
- 4528 Kingsbury St
- 4530 Kingsbury St
- 4524 Kingsbury St
- 4521 Keystone St
- 4526 Keystone St
- 4522 Kingsbury St
- 4601 Keystone St
- 4524 Keystone St
- 4602 Kingsbury St
- 4530 Keystone St
- 4519 Keystone St
- 4520 Kingsbury St
- 4522 Keystone St
- 4604 Kingsbury St
- 4527 Kingsbury St
- 4517 Keystone St
- 4602 Keystone St
- 4525 Kingsbury St