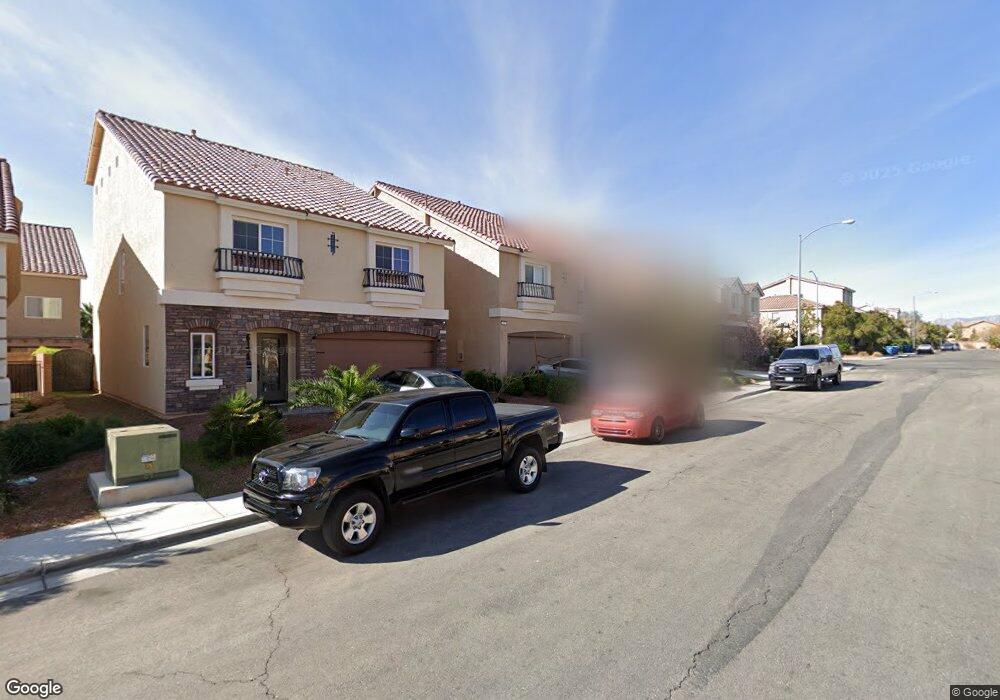
4527 Mission Meadow Cir Las Vegas, NV 89139
Coronado Ranch NeighborhoodEstimated Value: $524,151 - $592,000
4
Beds
4
Baths
2,614
Sq Ft
$210/Sq Ft
Est. Value
About This Home
This home is located at 4527 Mission Meadow Cir, Las Vegas, NV 89139 and is currently estimated at $548,788, approximately $209 per square foot. 4527 Mission Meadow Cir is a home with nearby schools including Dr. Beverly S. Mathis Elementary School, Lawrence & Heidi Canarelli Middle School, and Desert Oasis High School.
Ownership History
Date
Name
Owned For
Owner Type
Purchase Details
Closed on
Oct 8, 2012
Sold by
Irvine Su Young
Bought by
Irvine James M
Current Estimated Value
Home Financials for this Owner
Home Financials are based on the most recent Mortgage that was taken out on this home.
Original Mortgage
$253,483
Outstanding Balance
$175,482
Interest Rate
3.58%
Mortgage Type
VA
Estimated Equity
$373,306
Purchase Details
Closed on
Sep 14, 2012
Sold by
Carmel Hills Llc
Bought by
Irvine James M
Home Financials for this Owner
Home Financials are based on the most recent Mortgage that was taken out on this home.
Original Mortgage
$253,483
Outstanding Balance
$175,482
Interest Rate
3.58%
Mortgage Type
VA
Estimated Equity
$373,306
Purchase Details
Closed on
Dec 28, 2011
Sold by
Fairmont 2 Llc
Bought by
Carmel Hills Llc
Purchase Details
Closed on
Mar 31, 2010
Sold by
Fairmont 1 Inc
Bought by
Fairmont 2 Llc
Create a Home Valuation Report for This Property
The Home Valuation Report is an in-depth analysis detailing your home's value as well as a comparison with similar homes in the area
Home Values in the Area
Average Home Value in this Area
Purchase History
| Date | Buyer | Sale Price | Title Company |
|---|---|---|---|
| Irvine James M | -- | First American Title Centra | |
| Irvine James M | $248,148 | First American Title Centra | |
| Carmel Hills Llc | -- | Accommodation | |
| Fairmont 2 Llc | -- | Accommodation |
Source: Public Records
Mortgage History
| Date | Status | Borrower | Loan Amount |
|---|---|---|---|
| Open | Irvine James M | $253,483 |
Source: Public Records
Tax History Compared to Growth
Tax History
| Year | Tax Paid | Tax Assessment Tax Assessment Total Assessment is a certain percentage of the fair market value that is determined by local assessors to be the total taxable value of land and additions on the property. | Land | Improvement |
|---|---|---|---|---|
| 2025 | $2,690 | $156,566 | $40,250 | $116,316 |
| 2024 | $2,612 | $156,566 | $40,250 | $116,316 |
| 2023 | $2,107 | $140,838 | $31,500 | $109,338 |
| 2022 | $2,536 | $129,102 | $29,750 | $99,352 |
| 2021 | $2,463 | $120,392 | $26,250 | $94,142 |
| 2020 | $2,388 | $117,495 | $24,500 | $92,995 |
| 2019 | $2,359 | $113,819 | $22,750 | $91,069 |
| 2018 | $2,251 | $103,960 | $17,150 | $86,810 |
| 2017 | $2,894 | $98,664 | $17,150 | $81,514 |
| 2016 | $2,107 | $81,859 | $15,750 | $66,109 |
| 2015 | $2,103 | $87,190 | $17,150 | $70,040 |
| 2014 | $2,041 | $7,000 | $7,000 | $0 |
Source: Public Records
Map
Nearby Homes
- 4552 Mission Meadow Cir
- 4535 Mission Meadow Cir
- 4519 Mission Meadow Cir
- 8448 Cambria Cellars Ct
- 8454 Mondavi Hill Ct Unit 3
- 8354 Bismark Sapphire St
- 8253 Pearl Oasis Ct Unit 6A
- 8252 Pearl Oasis Ct
- 4749 Golden Shimmer Ave
- 4756 Golden Shimmer Ave
- 8175 Arville St Unit 99
- 8175 Arville St Unit 41
- 8175 Arville St Unit 315
- 8175 Arville St Unit 271
- 8175 Arville St Unit 171
- 8175 Arville St Unit 70
- 8175 Arville St Unit 300
- 8175 Arville St Unit 218
- 8175 Arville St Unit 1
- 8175 Arville St Unit 142
- 4543 Mission Meadow Cir
- 4511 Mission Meadow Cir
- 4530 W Camero Ave
- 4546 W Camero Ave
- 4522 W Camero Ave
- 4554 W Camero Ave
- 4528 Mission Meadow Cir
- 4503 Mission Meadow Cir
- 4520 Mission Meadow Cir
- 4514 W Camero Ave
- 4536 Mission Meadow Cir
- 4512 Mission Meadow Cir
- 4544 Mission Meadow Cir
- 4495 Mission Meadow Cir
- 4506 W Camero Ave
- 4567 Mission Meadow Cir
- 4567 Mission Meadow Cir Unit N
- 4498 W Camero Ave
- 4562 W Camero Ave
- 4487 Mission Meadow Cir