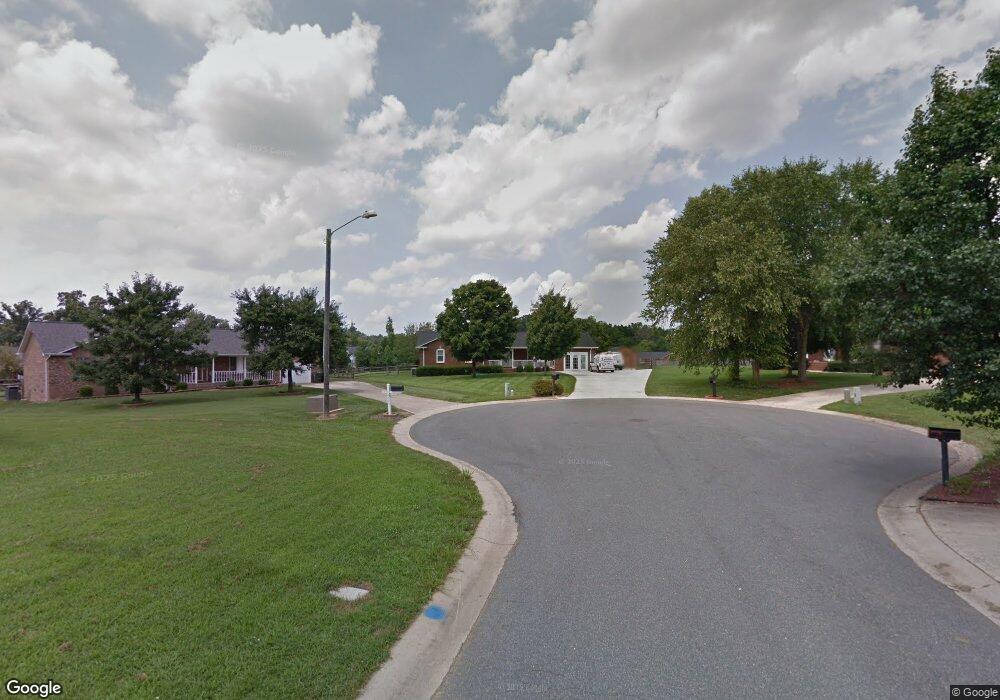
4527 Myers Rd Monroe, NC 28110
Estimated Value: $364,000 - $401,000
3
Beds
2
Baths
1,741
Sq Ft
$224/Sq Ft
Est. Value
About This Home
This home is located at 4527 Myers Rd, Monroe, NC 28110 and is currently estimated at $389,687, approximately $223 per square foot. 4527 Myers Rd is a home located in Union County with nearby schools including Porter Ridge Elementary School, Piedmont Middle School, and Piedmont High School.
Ownership History
Date
Name
Owned For
Owner Type
Purchase Details
Closed on
Jul 31, 2019
Sold by
Lee Myra Cannon and Cannon Myra Carmen
Bought by
Snider Mariah S and Snider Trampas G
Current Estimated Value
Home Financials for this Owner
Home Financials are based on the most recent Mortgage that was taken out on this home.
Original Mortgage
$196,377
Outstanding Balance
$172,342
Interest Rate
3.8%
Mortgage Type
FHA
Estimated Equity
$217,345
Purchase Details
Closed on
Feb 26, 2016
Sold by
Tyson Kenneth Dale and Tyson Tammy
Bought by
Lee Myra Cannon
Home Financials for this Owner
Home Financials are based on the most recent Mortgage that was taken out on this home.
Original Mortgage
$147,283
Interest Rate
3.75%
Mortgage Type
FHA
Purchase Details
Closed on
Sep 28, 2005
Sold by
Morton Lloyd B and Morton Dawn W
Bought by
Tyson Kenneth Dale and Johnson Tammy H
Home Financials for this Owner
Home Financials are based on the most recent Mortgage that was taken out on this home.
Original Mortgage
$146,000
Interest Rate
6%
Mortgage Type
Fannie Mae Freddie Mac
Create a Home Valuation Report for This Property
The Home Valuation Report is an in-depth analysis detailing your home's value as well as a comparison with similar homes in the area
Home Values in the Area
Average Home Value in this Area
Purchase History
| Date | Buyer | Sale Price | Title Company |
|---|---|---|---|
| Snider Mariah S | $200,000 | None Available | |
| Lee Myra Cannon | $150,000 | None Available | |
| Tyson Kenneth Dale | $146,000 | -- |
Source: Public Records
Mortgage History
| Date | Status | Borrower | Loan Amount |
|---|---|---|---|
| Open | Snider Mariah S | $196,377 | |
| Previous Owner | Lee Myra Cannon | $147,283 | |
| Previous Owner | Tyson Kenneth Dale | $146,000 |
Source: Public Records
Tax History Compared to Growth
Tax History
| Year | Tax Paid | Tax Assessment Tax Assessment Total Assessment is a certain percentage of the fair market value that is determined by local assessors to be the total taxable value of land and additions on the property. | Land | Improvement |
|---|---|---|---|---|
| 2024 | $2,711 | $248,600 | $44,900 | $203,700 |
| 2023 | $2,711 | $248,600 | $44,900 | $203,700 |
| 2022 | $2,711 | $248,600 | $44,900 | $203,700 |
| 2021 | $2,711 | $248,600 | $44,900 | $203,700 |
| 2020 | $2,095 | $155,510 | $29,410 | $126,100 |
| 2019 | $2,095 | $155,510 | $29,410 | $126,100 |
| 2018 | $958 | $155,510 | $29,410 | $126,100 |
| 2017 | $2,126 | $155,500 | $29,400 | $126,100 |
| 2016 | $2,104 | $155,510 | $29,410 | $126,100 |
| 2015 | $1,207 | $155,510 | $29,410 | $126,100 |
| 2014 | $1,868 | $153,150 | $38,550 | $114,600 |
Source: Public Records
Map
Nearby Homes
- 2907 Northwood Dr
- 4919 Myers Rd
- 4543 Tradd Cir
- 2822 Hopeton Ct
- 4822 Tradd Cir
- 4416 Poxon Ln
- 2903 Rosemeade Dr
- 4720 Tradd Cir
- 4112 Tricia Ct
- 2712 Thornburg Ct
- 4527 Marshall Ct
- 4700 Pickford Ct
- 4304 Mara Ln
- 4125 Chatterleigh Dr
- 4230 Chatterleigh Dr
- 4313 Chatterleigh Dr
- 2802 Santiago Cir
- 2909 Blueberry Dr
- 2809 James Hamilton Rd
- 2021 Twilight Ln
- 4505 Myers Rd
- 4509 Myers Rd
- 4512 Myers Rd
- 2903 Northwood Dr
- 4516 Myers Rd
- 4417 Myers Rd
- 4418 Myers Rd
- 2913 Northwood Dr
- 4414 Myers Rd
- 2914 Northwood Dr
- 4604 Myers Rd
- 4409 Myers Rd
- 4412 Myers Rd
- 2917 Northwood Dr
- 2901 Cameron Woods Dr
- 4608 Myers Rd
- 2711 Joselynn Ct Unit 137
- 2711 Joselynn Ct
- 4406 Richland Ct
- 2905 Cameron Woods Dr