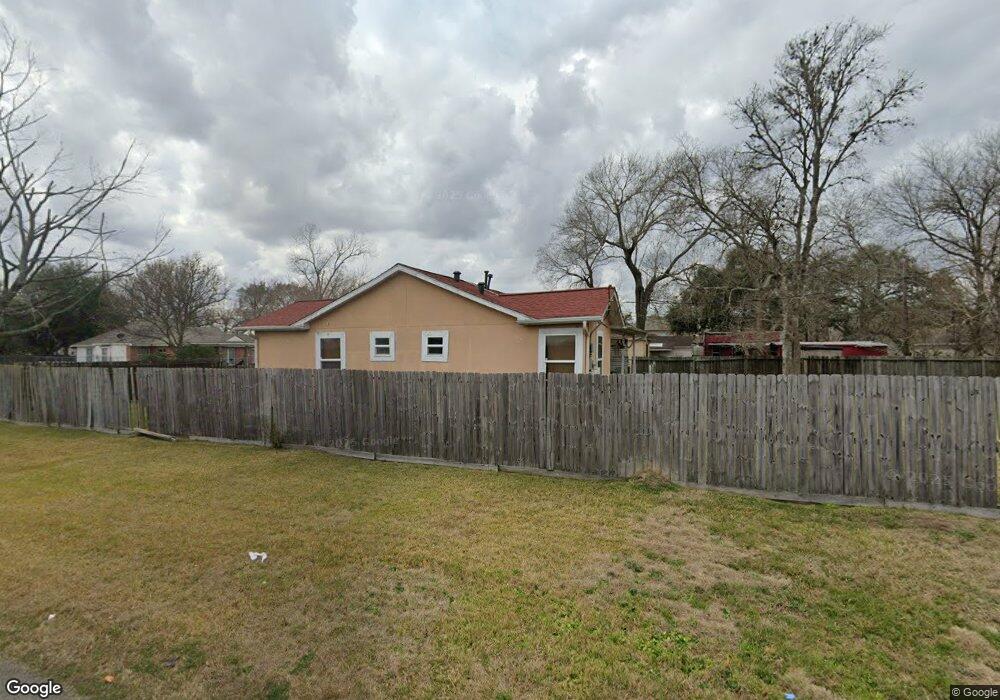
4529 Dixie Dr Houston, TX 77021
OST-South Union NeighborhoodEstimated Value: $217,000 - $254,000
3
Beds
2
Baths
1,307
Sq Ft
$183/Sq Ft
Est. Value
About This Home
This home is located at 4529 Dixie Dr, Houston, TX 77021 and is currently estimated at $238,632, approximately $182 per square foot. 4529 Dixie Dr is a home located in Harris County with nearby schools including Peck Elementary School, Cullen Middle School, and Yates High School.
Ownership History
Date
Name
Owned For
Owner Type
Purchase Details
Closed on
Nov 17, 2009
Sold by
Crabtree Michael W and Hogan Carl Wayne
Bought by
Ovalle Laura
Current Estimated Value
Home Financials for this Owner
Home Financials are based on the most recent Mortgage that was taken out on this home.
Original Mortgage
$45,000
Outstanding Balance
$29,278
Interest Rate
4.93%
Mortgage Type
Stand Alone Second
Estimated Equity
$209,354
Purchase Details
Closed on
May 5, 2000
Sold by
Rubio Lionel
Bought by
Crabtree Michael W
Home Financials for this Owner
Home Financials are based on the most recent Mortgage that was taken out on this home.
Original Mortgage
$53,200
Interest Rate
8.18%
Purchase Details
Closed on
Jul 30, 1999
Sold by
Bell Isadore B
Bought by
Rubio Lionel
Create a Home Valuation Report for This Property
The Home Valuation Report is an in-depth analysis detailing your home's value as well as a comparison with similar homes in the area
Home Values in the Area
Average Home Value in this Area
Purchase History
| Date | Buyer | Sale Price | Title Company |
|---|---|---|---|
| Ovalle Laura | -- | Startex 03 | |
| Crabtree Michael W | -- | Alamo Title #24 | |
| Rubio Lionel | -- | Alamo Title 23 |
Source: Public Records
Mortgage History
| Date | Status | Borrower | Loan Amount |
|---|---|---|---|
| Open | Ovalle Laura | $45,000 | |
| Closed | Ovalle Laura | $39,072 | |
| Previous Owner | Crabtree Michael W | $53,200 |
Source: Public Records
Tax History Compared to Growth
Tax History
| Year | Tax Paid | Tax Assessment Tax Assessment Total Assessment is a certain percentage of the fair market value that is determined by local assessors to be the total taxable value of land and additions on the property. | Land | Improvement |
|---|---|---|---|---|
| 2025 | $32 | $266,626 | $108,800 | $157,826 |
| 2024 | $32 | $281,559 | $108,800 | $172,759 |
| 2023 | $32 | $277,020 | $99,200 | $177,820 |
| 2022 | $3,695 | $235,517 | $89,600 | $145,917 |
| 2021 | $3,556 | $185,079 | $54,400 | $130,679 |
| 2020 | $3,002 | $143,743 | $35,200 | $108,543 |
| 2019 | $2,852 | $147,328 | $35,200 | $112,128 |
| 2018 | $353 | $102,458 | $28,800 | $73,658 |
| 2017 | $2,591 | $102,458 | $28,800 | $73,658 |
| 2016 | $2,591 | $102,458 | $28,800 | $73,658 |
| 2015 | $473 | $102,458 | $28,800 | $73,658 |
| 2014 | $473 | $88,573 | $16,000 | $72,573 |
Source: Public Records
Map
Nearby Homes
- 4522 Dixie Dr
- 4523 Keystone St
- 4603 Keystone St
- 4604 Keystone St
- 3917, 3919 Griggs Rd
- 4504 Kingsbury St
- 4624 Kingsbury St
- 4613 Dewberry St
- 4522 Dewberry St
- 6014 Grace Ln Unit A/B
- 5902 Grace Ln
- 5822 Grace Ln
- 6919 Calhoun Rd
- 5811 Eastwood St
- 4509 Perry St
- 6302 Calhoun Rd
- 5831 Grace Ln
- 0 New York St
- 6109 Grace Ln
- 4516 Perry St
- 4530 Normandy Wa
- 4525 Dixie Dr
- 4528 Normandy Way
- 4526 Normandy Way
- 4530 Dixie Dr
- 4523 Dixie Dr
- 4528 Dixie Dr
- 4524 Normandy Way
- 4521 Dixie Dr
- 4530 Normandy Way
- 4522 Normandy Way
- 4524 Dixie Dr
- 4529 Kingsbury St
- 4519 Dixie Dr
- 4529 Normandy Way
- 4527 Kingsbury St
- 4527 Normandy Way
- 4525 Kingsbury St
- 4525 Normandy Way
- 4523 Normandy Way