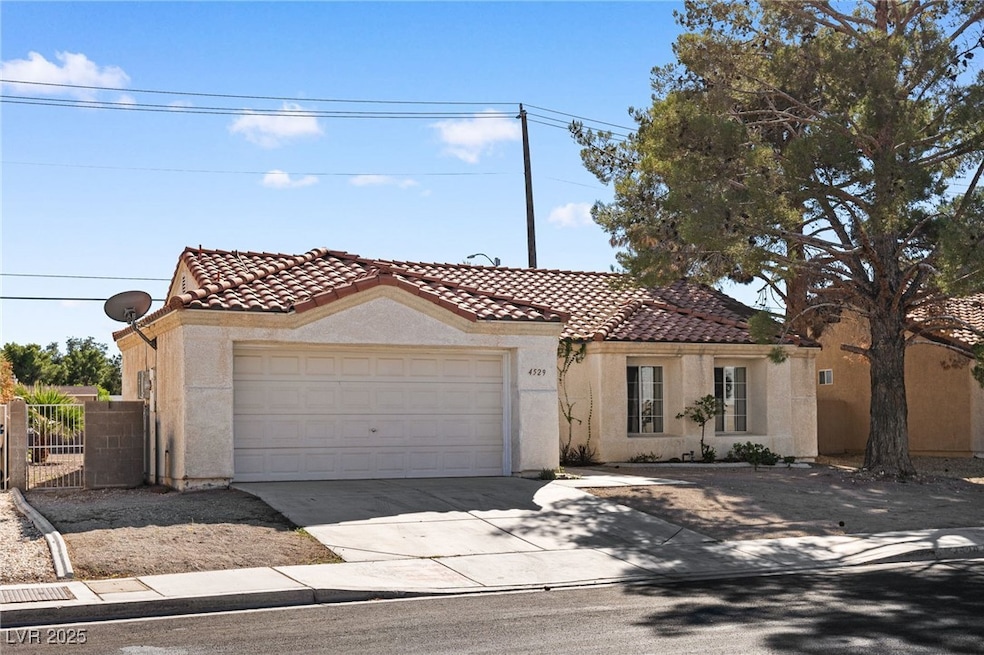
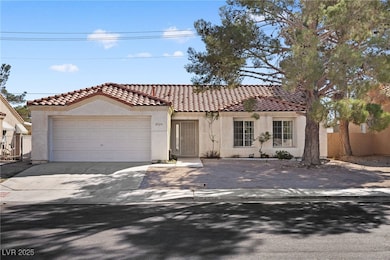
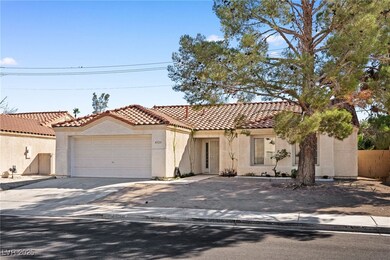
4529 Point Breeze Dr North Las Vegas, NV 89031
Craig Ranch NeighborhoodEstimated payment $2,052/month
Highlights
- Private Yard
- Covered Patio or Porch
- Double Pane Windows
- No HOA
- 2 Car Attached Garage
- Controlled Access
About This Home
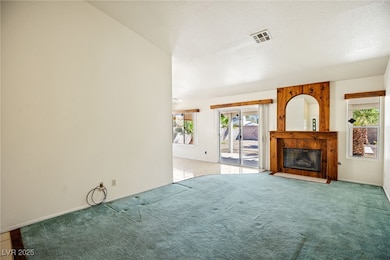
Discover the hidden potential in this charming 3-bedroom, 2-bath home, offering 1,266 sq ft of comfortable living space on a generous 7,405 sq ft lot. Built in 1994, this house comes with a 2-car garage, energy-saving solar panels, and a huge backyard with endless possibilities. Inside, a custom wood fireplace surround adds warmth and character to the living room. Nestled in a quiet neighborhood, this home enjoys a great location and has good bones, offering plenty of upside potential. With a little TLC, you can make this gem shine! Imagine the transformation with fresh paint, new flooring, and rejuvenated landscaping. Ideal for first-time buyers or a handy owner-occupant looking for a fixer-upper, this property is brimming with opportunity. Bring your vision and toolkit to build equity in this wonderful home – a fantastic chance to create your dream space while adding value! Seller is going to make someone a great deal.
Listing Agent
Christopher Homes Realty Brokerage Phone: 702-838-3000 License #B.0034112 Listed on: 10/16/2025
Home Details
Home Type
- Single Family
Est. Annual Taxes
- $1,235
Year Built
- Built in 1994
Lot Details
- 7,405 Sq Ft Lot
- North Facing Home
- Property is Fully Fenced
- Block Wall Fence
- Drip System Landscaping
- Backyard Sprinklers
- Private Yard
Parking
- 2 Car Attached Garage
- Inside Entrance
- Garage Door Opener
Home Design
- Tile Roof
Interior Spaces
- 1,266 Sq Ft Home
- 1-Story Property
- Ceiling Fan
- Gas Fireplace
- Double Pane Windows
- Blinds
- Drapes & Rods
- Living Room with Fireplace
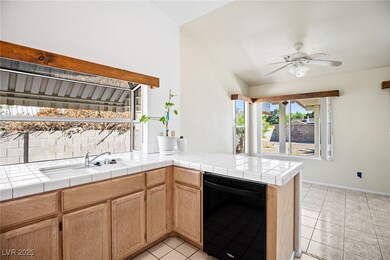
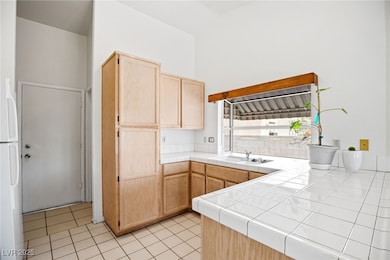
Kitchen
- Gas Range
- Microwave
- Disposal
Flooring
- Carpet
- Concrete
- Ceramic Tile
Bedrooms and Bathrooms
- 3 Bedrooms
- 2 Full Bathrooms
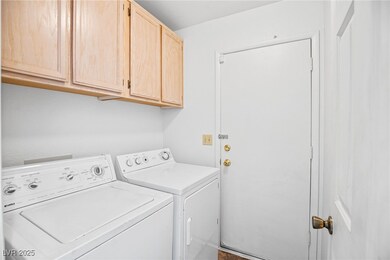
Laundry
- Laundry Room
- Laundry on main level
- Dryer
- Washer
Schools
- Wolff Elementary School
- Swainston Theron Middle School
- Cheyenne High School
Utilities
- Central Heating and Cooling System
- Heating System Uses Gas
- Underground Utilities
Additional Features
- Energy-Efficient Windows
- Covered Patio or Porch
Community Details
Overview
- No Home Owners Association
- Summer Breeze Phase 1 Subdivision
Security
- Controlled Access
Map
Home Values in the Area
Average Home Value in this Area
Tax History
| Year | Tax Paid | Tax Assessment Tax Assessment Total Assessment is a certain percentage of the fair market value that is determined by local assessors to be the total taxable value of land and additions on the property. | Land | Improvement |
|---|---|---|---|---|
| 2025 | $1,235 | $75,041 | $30,800 | $44,241 |
| 2024 | $1,200 | $75,041 | $30,800 | $44,241 |
| 2023 | $979 | $71,903 | $29,750 | $42,153 |
| 2022 | $1,165 | $62,134 | $23,450 | $38,684 |
| 2021 | $1,131 | $58,226 | $21,350 | $36,876 |
| 2020 | $1,095 | $58,045 | $21,350 | $36,695 |
| 2019 | $1,063 | $53,877 | $17,500 | $36,377 |
| 2018 | $1,032 | $49,421 | $14,350 | $35,071 |
| 2017 | $1,604 | $47,812 | $12,250 | $35,562 |
| 2016 | $979 | $45,746 | $9,800 | $35,946 |
| 2015 | $978 | $37,249 | $8,400 | $28,849 |
| 2014 | $947 | $28,181 | $5,250 | $22,931 |
Property History
| Date | Event | Price | List to Sale | Price per Sq Ft |
|---|---|---|---|---|
| 10/16/2025 10/16/25 | For Sale | $368,999 | -- | $291 / Sq Ft |
Purchase History
| Date | Type | Sale Price | Title Company |
|---|---|---|---|
| Bargain Sale Deed | $97,000 | Ticor Title Las Vegas | |
| Trustee Deed | $125,800 | Accommodation | |
| Bargain Sale Deed | $268,700 | Ticor Title Of Nevada Inc | |
| Grant Deed | $100,000 | First American Title Company |
Mortgage History
| Date | Status | Loan Amount | Loan Type |
|---|---|---|---|
| Previous Owner | $95,243 | FHA | |
| Previous Owner | $214,800 | Unknown |
Source: Las Vegas REALTORS®
MLS Number: 2727916
APN: 124-31-411-004
Disclaimer: Certain information contained herein is derived from information provided by parties other than Homes.com. All information provided is deemed reliable, but is not guaranteed to be accurate and should be independently verified.
![]() The data relating to real estate for sale on this web site comes in part from the INTERNET DATA EXCHANGE Program of the Greater Las Vegas Association of REALTORS® MLS. Real estate listings held by brokerage firms other than this site owner are marked with the IDX logo. Information is deemed reliable but not guaranteed. Copyright 2025 of the Greater Las Vegas Association of REALTORS® MLS. All rights reserved.
The data relating to real estate for sale on this web site comes in part from the INTERNET DATA EXCHANGE Program of the Greater Las Vegas Association of REALTORS® MLS. Real estate listings held by brokerage firms other than this site owner are marked with the IDX logo. Information is deemed reliable but not guaranteed. Copyright 2025 of the Greater Las Vegas Association of REALTORS® MLS. All rights reserved.
- 4745 Gunlock Cir
- 4413 Summer Glen Ln
- 4800 Baffin Ct
- 4336 Shannon Valley Ave
- 4427 Pageantry Falls Dr
- 4636 Victoria Beach Way
- 4701 Victoria Beach Way
- 4809 Braeburn Dr
- 4323 Pageantry Falls Dr
- 4904 Pinon Dr
- 4508 San Mateo St
- 5004 Deep Forest Dr
- 4708 English Ivy Ct
- 5119 Waving Flower Dr
- 5004 Camino Del Rancho
- 4852 Maryvale Dr
- 5214 Rock Cabin Ct
- 5213 Castle Butte Ct
- 4837 Maryvale Dr
- 4933 Fiesta Lakes St
- 4617 Rachel Ann Ave
- 4412 W La Madre Way
- 5037 Sock Hop Way
- 4623 Candlas Way
- 4552 Del Pappa Ct
- 5101 Future Dr
- 5255 Cedar Bend Dr
- 4511 Grotto Ct
- 4205 San Rocco Ct
- 4426 Cinema Ave
- 5304 Del Lago Dr
- 4622 English Lavender Ave
- 4714 English Lavender Ave
- 5429 Lavender Grove Ct
- 5409 Ravana Ave
- 5443 Wheatberry Ct
- 5443 Cape Jasmine Ct
- 3825 Craig Crossing Dr
- 4415 Chipwood Ct
- 5537 Sentinel Bridge St
