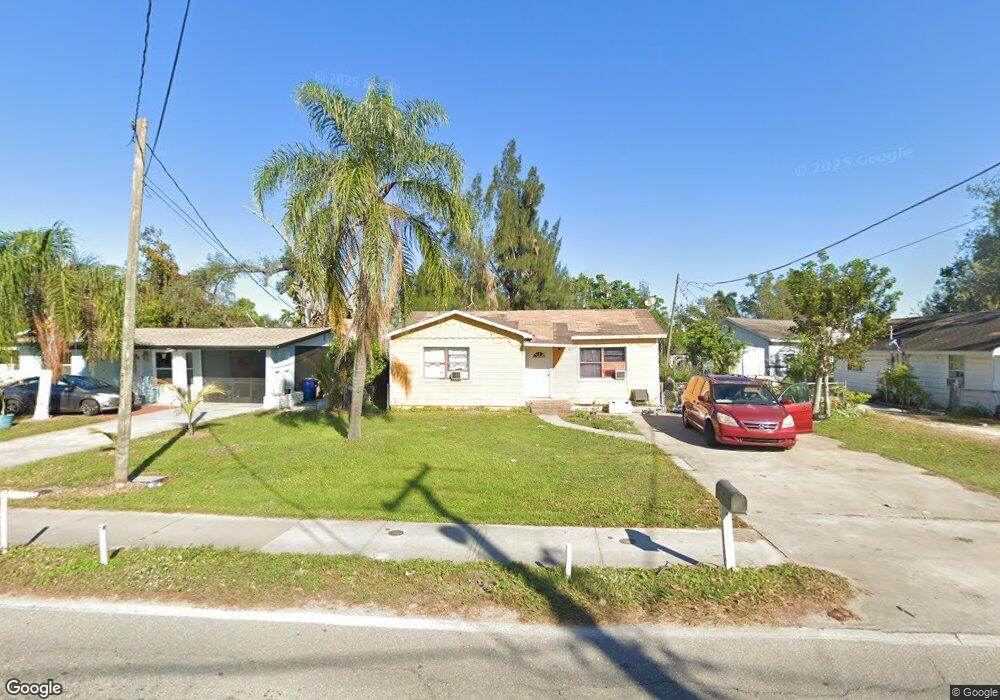
4529 Tice St Fort Myers, FL 33905
Estimated Value: $120,000 - $166,000
2
Beds
1
Bath
929
Sq Ft
$153/Sq Ft
Est. Value
About This Home
This home is located at 4529 Tice St, Fort Myers, FL 33905 and is currently estimated at $142,375, approximately $153 per square foot. 4529 Tice St is a home located in Lee County with nearby schools including Tice Elementary School, Orange River Elementary School, and Edgewood Academy.
Ownership History
Date
Name
Owned For
Owner Type
Purchase Details
Closed on
Apr 8, 2019
Sold by
Kelly Thomas M
Bought by
Tice Trading Post Inc and Tice Street Land Trust
Current Estimated Value
Purchase Details
Closed on
Sep 4, 2015
Sold by
Morelalia Llc
Bought by
Kelly Thomas M
Purchase Details
Closed on
Feb 28, 2007
Sold by
Swflre Inc
Bought by
Williams Gary
Home Financials for this Owner
Home Financials are based on the most recent Mortgage that was taken out on this home.
Original Mortgage
$117,810
Interest Rate
7.47%
Mortgage Type
Unknown
Purchase Details
Closed on
Feb 28, 2006
Sold by
Nassoiy Michael L
Bought by
Swflre Inc
Home Financials for this Owner
Home Financials are based on the most recent Mortgage that was taken out on this home.
Original Mortgage
$25,000
Interest Rate
12%
Mortgage Type
Stand Alone First
Create a Home Valuation Report for This Property
The Home Valuation Report is an in-depth analysis detailing your home's value as well as a comparison with similar homes in the area
Home Values in the Area
Average Home Value in this Area
Purchase History
| Date | Buyer | Sale Price | Title Company |
|---|---|---|---|
| Tice Trading Post Inc | $65,000 | Willkinson Title Agency Inc | |
| Kelly Thomas M | $24,900 | Entitled Llc | |
| Williams Gary | $130,900 | Gulfstream Title Llc | |
| Swflre Inc | $100,000 | Gulfstream Title Llc |
Source: Public Records
Mortgage History
| Date | Status | Borrower | Loan Amount |
|---|---|---|---|
| Previous Owner | Williams Gary | $117,810 | |
| Previous Owner | Swflre Inc | $25,000 |
Source: Public Records
Tax History Compared to Growth
Tax History
| Year | Tax Paid | Tax Assessment Tax Assessment Total Assessment is a certain percentage of the fair market value that is determined by local assessors to be the total taxable value of land and additions on the property. | Land | Improvement |
|---|---|---|---|---|
| 2025 | $1,739 | $65,615 | $25,840 | $37,793 |
| 2024 | $1,510 | $79,213 | -- | -- |
| 2023 | $1,510 | $72,012 | $0 | $0 |
| 2022 | $1,334 | $65,465 | $0 | $0 |
| 2021 | $1,171 | $60,560 | $10,874 | $49,686 |
| 2020 | $1,085 | $54,104 | $4,125 | $49,979 |
| 2019 | $890 | $49,261 | $4,800 | $44,461 |
| 2018 | $803 | $38,762 | $4,000 | $34,762 |
| 2017 | $722 | $30,688 | $5,000 | $25,688 |
| 2016 | $687 | $28,989 | $5,511 | $23,478 |
| 2015 | $559 | $26,401 | $3,233 | $23,168 |
| 2014 | $524 | $26,198 | $3,235 | $22,963 |
| 2013 | -- | $21,499 | $3,607 | $17,892 |
Source: Public Records
Map
Nearby Homes
- 466 Wilma Ave
- 567 Ione Ave
- 407 Baltimore Ave
- 4421 Bessie Ave
- 595 Carolina Ave
- 372 Altamont Ave
- 4566 Seminole St
- 647 Nuna Ave Unit 47
- 647 Nuna Ave Unit 8
- 152 Prospect Ave
- 653 Howells Circle Dr
- 4546 Tennessee Way
- 115 Prospect Ave
- 633 Carolina Ave
- 142 Palm Tree Ln
- 120 Palm Tree Ln
- 345 Georgia Ln
- 62 Prospect Ave
- 4241 Riverview Rd
- 4460 Scott Ave