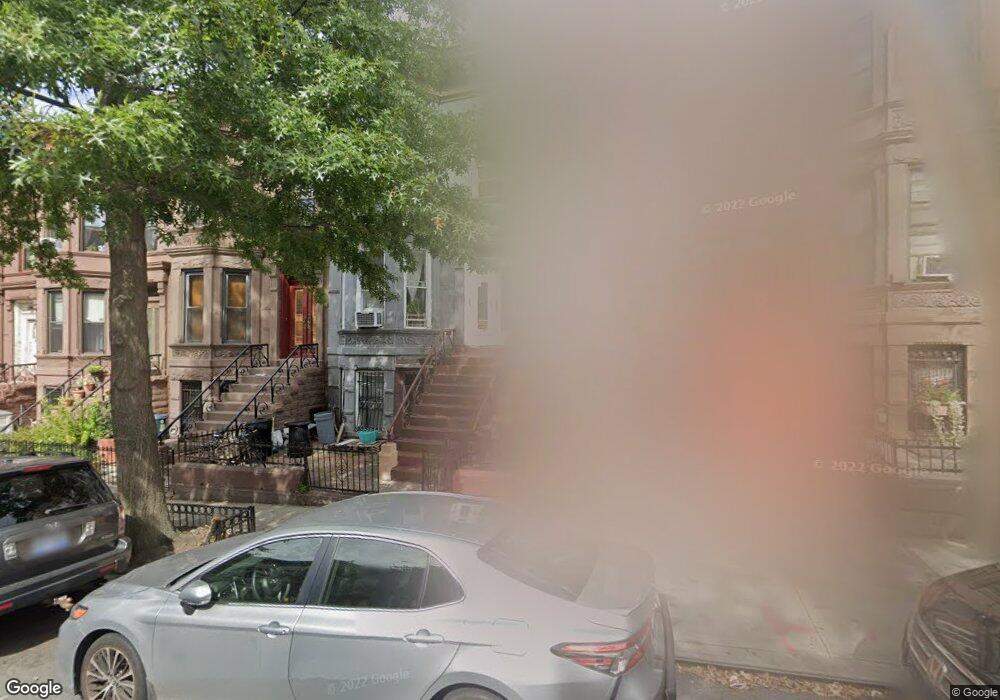
453 45th St Brooklyn, NY 11220
Sunset Park NeighborhoodEstimated Value: $896,858 - $1,736,000
Studio
--
Bath
2,712
Sq Ft
$543/Sq Ft
Est. Value
About This Home
This home is located at 453 45th St, Brooklyn, NY 11220 and is currently estimated at $1,473,715, approximately $543 per square foot. 453 45th St is a home located in Kings County with nearby schools including Sunset Park Avenue Elementary School and Tomer Devorah High School for Girls.
Ownership History
Date
Name
Owned For
Owner Type
Purchase Details
Closed on
Apr 25, 2024
Sold by
Tolentino David A and Tolentino Miriam A
Bought by
Chen Jian and Wang Zhou
Current Estimated Value
Home Financials for this Owner
Home Financials are based on the most recent Mortgage that was taken out on this home.
Original Mortgage
$522,000
Outstanding Balance
$514,667
Interest Rate
6.87%
Mortgage Type
Purchase Money Mortgage
Estimated Equity
$959,048
Create a Home Valuation Report for This Property
The Home Valuation Report is an in-depth analysis detailing your home's value as well as a comparison with similar homes in the area
Home Values in the Area
Average Home Value in this Area
Purchase History
| Date | Buyer | Sale Price | Title Company |
|---|---|---|---|
| Chen Jian | $870,000 | -- | |
| Chen Jian | $870,000 | -- |
Source: Public Records
Mortgage History
| Date | Status | Borrower | Loan Amount |
|---|---|---|---|
| Open | Chen Jian | $522,000 | |
| Closed | Chen Jian | $522,000 |
Source: Public Records
Tax History
| Year | Tax Paid | Tax Assessment Tax Assessment Total Assessment is a certain percentage of the fair market value that is determined by local assessors to be the total taxable value of land and additions on the property. | Land | Improvement |
|---|---|---|---|---|
| 2025 | $6,992 | $86,340 | $16,380 | $69,960 |
| 2024 | $6,992 | $82,560 | $16,380 | $66,180 |
| 2023 | $6,670 | $101,280 | $16,380 | $84,900 |
| 2022 | $6,557 | $91,680 | $16,380 | $75,300 |
| 2021 | $6,860 | $76,980 | $16,380 | $60,600 |
| 2019 | $6,069 | $60,120 | $16,380 | $43,740 |
| 2018 | $5,579 | $27,370 | $5,614 | $21,756 |
| 2017 | $5,579 | $27,370 | $6,768 | $20,602 |
| 2016 | $5,430 | $27,163 | $9,065 | $18,098 |
| 2015 | $3,114 | $25,627 | $7,929 | $17,698 |
| 2014 | $3,114 | $24,177 | $7,934 | $16,243 |
Source: Public Records
Map
Nearby Homes
Your Personal Tour Guide
Ask me questions while you tour the home.