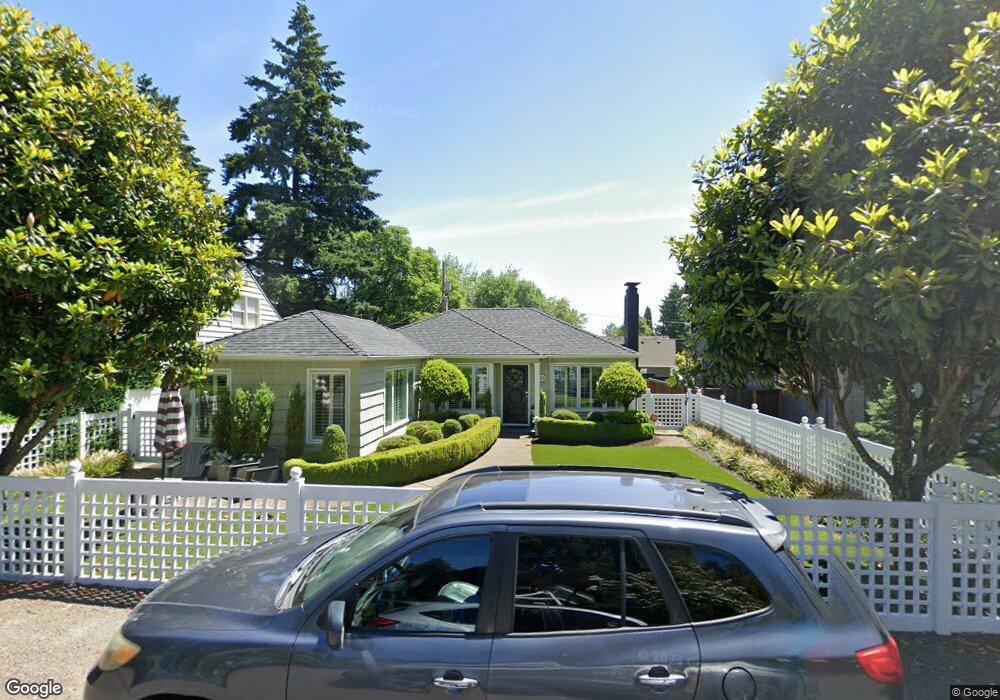
453 8th St Lake Oswego, OR 97034
Evergreen NeighborhoodEstimated Value: $850,000 - $1,463,000
2
Beds
1
Bath
1,528
Sq Ft
$837/Sq Ft
Est. Value
About This Home
This home is located at 453 8th St, Lake Oswego, OR 97034 and is currently estimated at $1,279,516, approximately $837 per square foot. 453 8th St is a home located in Clackamas County with nearby schools including Forest Hills Elementary School, Lake Oswego Junior High School, and Lake Oswego Senior High School.
Ownership History
Date
Name
Owned For
Owner Type
Purchase Details
Closed on
May 9, 2025
Sold by
Paesler Summer Jameson and Paesler Mark
Bought by
M S Paesler Revocable Trust and Paesler
Current Estimated Value
Purchase Details
Closed on
Apr 22, 2013
Sold by
Jameson Summer L
Bought by
Paesler Summer Jameson and Paesler Mark
Purchase Details
Closed on
Nov 7, 2002
Sold by
Focus Investments Llc
Bought by
Jameson Summer L
Home Financials for this Owner
Home Financials are based on the most recent Mortgage that was taken out on this home.
Original Mortgage
$216,000
Interest Rate
5.88%
Purchase Details
Closed on
Dec 20, 1999
Sold by
Hopkins Randy L
Bought by
Elardo Sandra M
Home Financials for this Owner
Home Financials are based on the most recent Mortgage that was taken out on this home.
Original Mortgage
$118,500
Interest Rate
7.69%
Mortgage Type
Credit Line Revolving
Create a Home Valuation Report for This Property
The Home Valuation Report is an in-depth analysis detailing your home's value as well as a comparison with similar homes in the area
Home Values in the Area
Average Home Value in this Area
Purchase History
| Date | Buyer | Sale Price | Title Company |
|---|---|---|---|
| M S Paesler Revocable Trust | -- | None Listed On Document | |
| Paesler Summer Jameson | -- | None Available | |
| Jameson Summer L | $276,300 | First American Title Ins Co | |
| Elardo Sandra M | $174,000 | Fidelity National Title Co |
Source: Public Records
Mortgage History
| Date | Status | Borrower | Loan Amount |
|---|---|---|---|
| Previous Owner | Jameson Summer L | $216,000 | |
| Previous Owner | Elardo Sandra M | $118,500 |
Source: Public Records
Tax History Compared to Growth
Tax History
| Year | Tax Paid | Tax Assessment Tax Assessment Total Assessment is a certain percentage of the fair market value that is determined by local assessors to be the total taxable value of land and additions on the property. | Land | Improvement |
|---|---|---|---|---|
| 2025 | $10,699 | $558,354 | -- | -- |
| 2024 | $10,414 | $542,092 | -- | -- |
| 2023 | $10,414 | $526,303 | $0 | $0 |
| 2022 | $9,808 | $510,974 | $0 | $0 |
| 2021 | $9,058 | $496,092 | $0 | $0 |
| 2020 | $8,830 | $481,643 | $0 | $0 |
| 2019 | $8,613 | $467,615 | $0 | $0 |
| 2018 | $8,191 | $453,995 | $0 | $0 |
| 2017 | $7,903 | $440,772 | $0 | $0 |
| 2016 | $7,194 | $427,934 | $0 | $0 |
| 2015 | $5,936 | $354,844 | $0 | $0 |
| 2014 | $3,825 | $224,917 | $0 | $0 |
Source: Public Records
Map
Nearby Homes