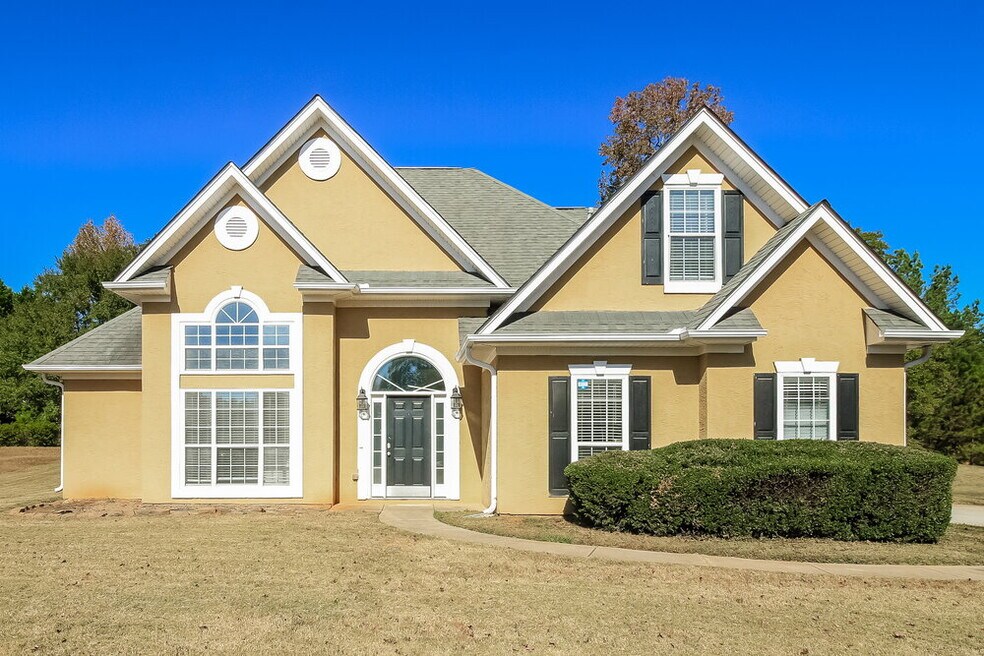
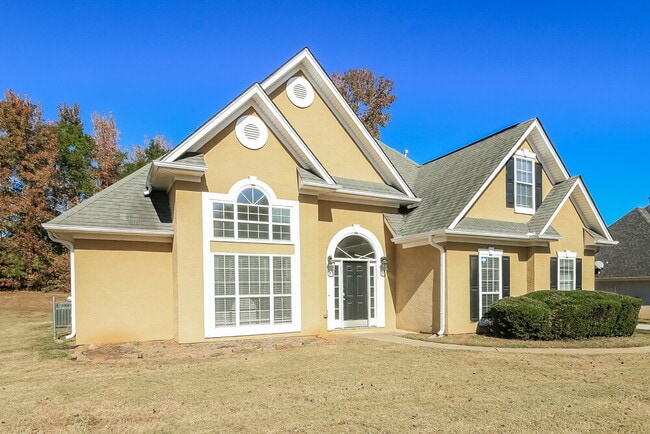
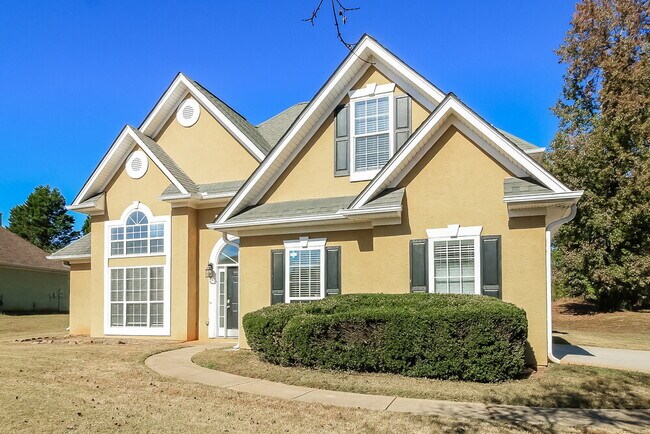
453 Aviemore Loop McDonough, GA 30253
About This Home
Please note, our homes are available on a first-come, first-serve basis and are not reserved until the lease is signed by all applicants and security deposits are collected.
This home features Progress Smart Home - Progress Residential's smart home app, which allows you to control the home securely from any of your devices. Learn more at
Rent this home by December 31, 2025 and receive $500.
Want to tour on your own? Click the “Self Tour” button on this home’s listing or call to register for a self-guided showing at a time that works best for you.
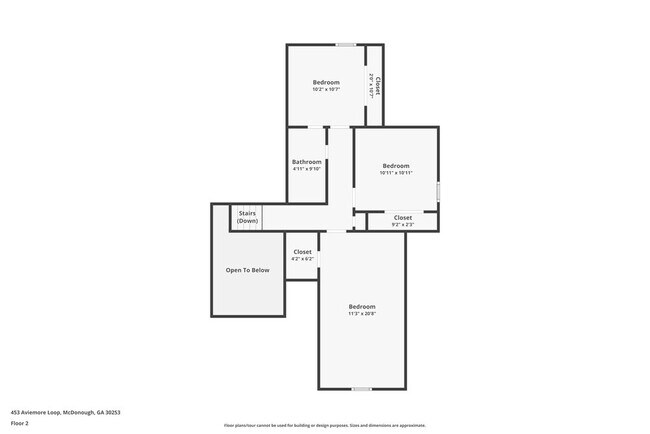
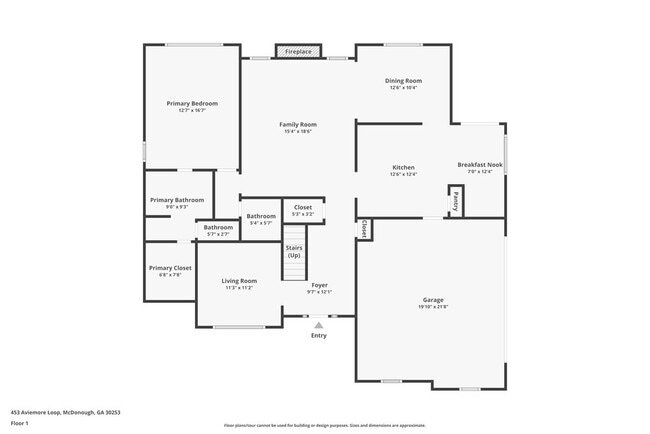
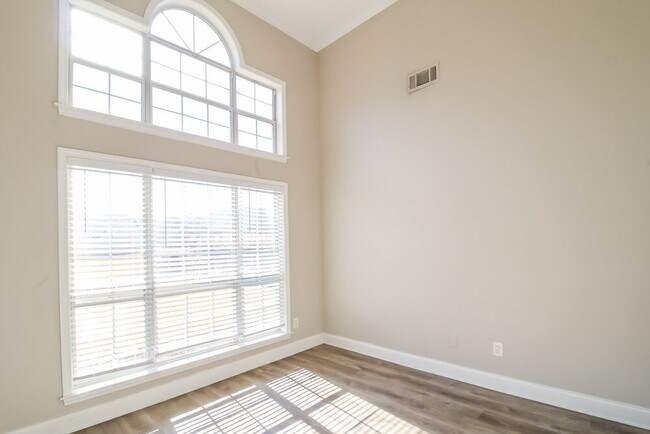
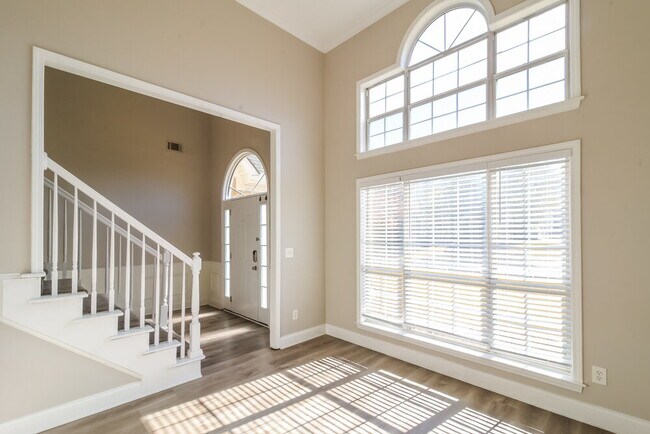
Interested in this home? You clearly have exceptional taste. This charming 4.0-bedroom, 2.5-bathroom home is not only pet-friendly, but also equipped with smart home features to make everyday life more convenient and connected. Homes like this don’t stay on the market for long—don’t miss your chance to make it yours. Apply today!
The Homeowners Association (HOA) for this home has a separate application process that applicants will need to complete in addition to Progress Residential's application. This includes self-registering with the HOA, completing the HOA's approval process, and paying any fees required by the HOA.
Some images have been virtually staged to help showcase the potential of spaces in the home. The furnishings shown are for illustrative purposes only and are not included in the home.

Map
Property History
| Date | Event | Price | List to Sale | Price per Sq Ft |
|---|---|---|---|---|
| 12/12/2025 12/12/25 | Price Changed | $2,085 | -1.2% | $1 / Sq Ft |
| 12/11/2025 12/11/25 | Price Changed | $2,110 | -0.2% | $1 / Sq Ft |
| 12/08/2025 12/08/25 | Price Changed | $2,115 | -1.2% | $1 / Sq Ft |
| 12/06/2025 12/06/25 | Price Changed | $2,140 | -0.2% | $1 / Sq Ft |
| 12/04/2025 12/04/25 | Price Changed | $2,145 | -0.9% | $1 / Sq Ft |
| 12/03/2025 12/03/25 | Price Changed | $2,165 | -0.2% | $1 / Sq Ft |
| 12/01/2025 12/01/25 | Price Changed | $2,170 | -0.2% | $1 / Sq Ft |
| 11/30/2025 11/30/25 | Price Changed | $2,175 | +3.1% | $1 / Sq Ft |
| 11/23/2025 11/23/25 | Price Changed | $2,110 | -1.9% | $1 / Sq Ft |
| 11/22/2025 11/22/25 | Price Changed | $2,150 | -1.1% | $1 / Sq Ft |
| 11/19/2025 11/19/25 | Price Changed | $2,175 | -1.1% | $1 / Sq Ft |
| 11/17/2025 11/17/25 | Price Changed | $2,200 | -0.2% | $1 / Sq Ft |
| 11/15/2025 11/15/25 | Price Changed | $2,205 | +1.4% | $1 / Sq Ft |
| 11/09/2025 11/09/25 | Price Changed | $2,175 | -3.1% | $1 / Sq Ft |
| 11/05/2025 11/05/25 | Price Changed | $2,245 | -2.8% | $1 / Sq Ft |
| 10/31/2025 10/31/25 | Price Changed | $2,310 | +2.0% | $1 / Sq Ft |
| 10/16/2025 10/16/25 | For Rent | $2,265 | -- | -- |
- 321 Inverness Ave
- 441 Aviemore Loop
- 113 Glenmore Ln
- 209 Braemar Ct
- 271 Mckinley Loop
- 479 Sawtooth Ln
- 172 Summit View Dr
- 221 Summit View Dr
- 1181 Paramount Dr
- 176 Cranapple Ln
- 401 Crosshaven Way
- 601 Sawgrass Walk
- 418 Abbey Springs Way
- 466 Astoria Way
- 153 Rockport Dr
- 152 Rockport Dr
- 212 Himalaya Way
- 248 Cranapple Ln
- 146 Himalaya Way
- 236 Himalaya Way
- 209 Braemar Ct Unit MAIN LEVEL (1A)
- 209 Braemar Ct Unit BASEMENT APARTMENT
- 209 Braemar Ct Unit 2
- 209 Braemar Ct Unit 1
- 224 Mckinley Loop
- 517 Cascade Walk
- 644 Aspen Brook Dr
- 402 Grandiflora Dr
- 1154 Paramount Dr
- 236 Windy Cir
- 232 Brannans Walk
- 197 Weldon Rd
- 145 Weldon Rd
- 1145 Chateau Terrace
- 105 Peach Pointe Dr
- 796 Rock Ln
- 910 Castlerock Way
- 1311 Vine Cir
- 1128 Chateau Terrace
- 1900 Waterford Landing