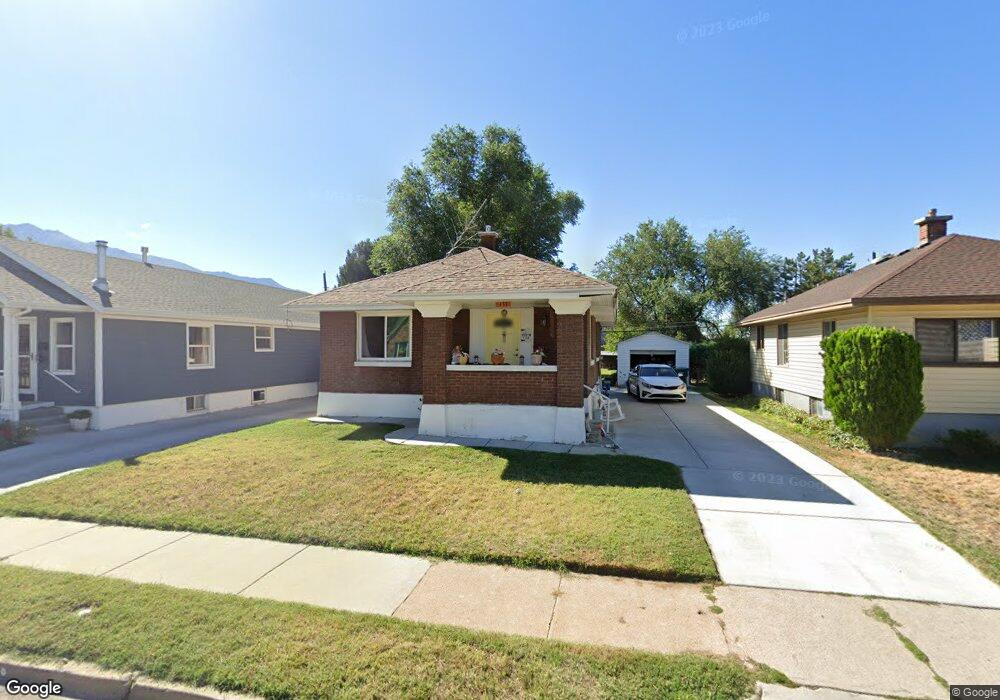
453 Cross St Ogden, UT 84404
Hillcrest-Bonneville NeighborhoodEstimated Value: $338,000 - $354,888
4
Beds
2
Baths
1,740
Sq Ft
$198/Sq Ft
Est. Value
About This Home
This home is located at 453 Cross St, Ogden, UT 84404 and is currently estimated at $343,972, approximately $197 per square foot. 453 Cross St is a home located in Weber County with nearby schools including Bonneville School, Highland Junior High School, and Ben Lomond High School.
Ownership History
Date
Name
Owned For
Owner Type
Purchase Details
Closed on
Mar 18, 2024
Sold by
Solorio Maria Lorena Gonzalez
Bought by
Gonzalez Maria Lorena
Current Estimated Value
Purchase Details
Closed on
Jun 11, 2003
Sold by
Graser Robert
Bought by
Gonzalez Maria Lorena and Duarte Serafin
Home Financials for this Owner
Home Financials are based on the most recent Mortgage that was taken out on this home.
Original Mortgage
$84,292
Interest Rate
5.61%
Mortgage Type
FHA
Create a Home Valuation Report for This Property
The Home Valuation Report is an in-depth analysis detailing your home's value as well as a comparison with similar homes in the area
Home Values in the Area
Average Home Value in this Area
Purchase History
| Date | Buyer | Sale Price | Title Company |
|---|---|---|---|
| Gonzalez Maria Lorena | -- | Inwest Title | |
| Gonzalez Maria Lorena | -- | Mountain View Title |
Source: Public Records
Mortgage History
| Date | Status | Borrower | Loan Amount |
|---|---|---|---|
| Previous Owner | Gonzalez Maria Lorena | $84,292 |
Source: Public Records
Tax History
| Year | Tax Paid | Tax Assessment Tax Assessment Total Assessment is a certain percentage of the fair market value that is determined by local assessors to be the total taxable value of land and additions on the property. | Land | Improvement |
|---|---|---|---|---|
| 2025 | $2,358 | $345,661 | $116,844 | $228,817 |
| 2024 | $2,237 | $177,098 | $64,264 | $112,834 |
| 2023 | $2,084 | $166,100 | $56,053 | $110,047 |
| 2022 | $2,286 | $182,600 | $47,737 | $134,863 |
| 2021 | $1,848 | $245,000 | $56,430 | $188,570 |
| 2020 | $1,535 | $187,999 | $45,444 | $142,555 |
| 2019 | $1,522 | $175,001 | $35,279 | $139,722 |
| 2018 | $1,313 | $150,001 | $30,999 | $119,002 |
| 2017 | $1,124 | $120,000 | $30,999 | $89,001 |
| 2016 | $1,035 | $59,704 | $13,606 | $46,098 |
| 2015 | $898 | $50,546 | $13,606 | $36,940 |
| 2014 | $914 | $50,545 | $11,860 | $38,685 |
Source: Public Records
Map
Nearby Homes
- 545 Chester St
- 968 S Jefferson Ave
- 1107 Jefferson Ave
- 909 Grant Ave
- 1110 Jefferson Ave
- 626 Chester St
- 719 S 350 E Unit 3
- 360 13th St
- 621 7th St
- 344 13th St
- 718 9th St
- 506 14th St
- 155 E 900 St S Unit 108
- 155 E 900 St S Unit 202
- 443 E 1415 S Unit 118
- 1116 Liberty Ave
- 439 E 1415 S Unit 117
- 433 E 1415 S Unit 116
- 425 E 1415 S Unit 114
- 235 13th St
Your Personal Tour Guide
Ask me questions while you tour the home.