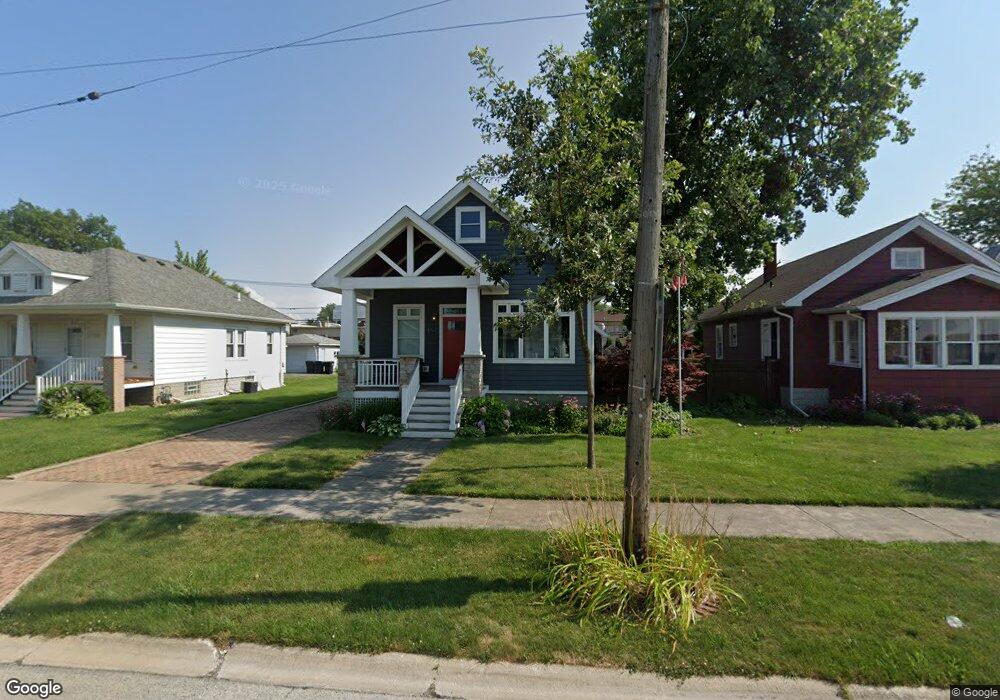
453 E 161st Place South Holland, IL 60473
South River-Cook County NeighborhoodEstimated Value: $139,000 - $207,000
2
Beds
1
Bath
1,567
Sq Ft
$115/Sq Ft
Est. Value
About This Home
This home is located at 453 E 161st Place, South Holland, IL 60473 and is currently estimated at $180,038, approximately $114 per square foot. 453 E 161st Place is a home located in Cook County with nearby schools including Taft School, Eisenhower School, and Coolidge Middle School.
Ownership History
Date
Name
Owned For
Owner Type
Purchase Details
Closed on
Nov 9, 2023
Sold by
Jabaay Jeremy and Jabaay Allison
Bought by
Jabaay Jeremy E and Jabbay Allison N
Current Estimated Value
Purchase Details
Closed on
May 12, 2008
Sold by
Deutsche Bank National Trust Co
Bought by
Blink Allison and Jabaay Jeremy
Purchase Details
Closed on
Jan 2, 2008
Sold by
Mcclain Lawanda
Bought by
Deutsche Bank National Trust Co and Long Beach Mortgage Loan Trust 2005-Wl1
Purchase Details
Closed on
May 23, 2007
Sold by
Mcclain Lawanda J
Bought by
Mcgee Reginald L
Purchase Details
Closed on
Mar 30, 2005
Sold by
Simmons Gregory
Bought by
Mcclain Lawanda
Home Financials for this Owner
Home Financials are based on the most recent Mortgage that was taken out on this home.
Original Mortgage
$107,899
Interest Rate
8.9%
Mortgage Type
Unknown
Create a Home Valuation Report for This Property
The Home Valuation Report is an in-depth analysis detailing your home's value as well as a comparison with similar homes in the area
Home Values in the Area
Average Home Value in this Area
Purchase History
| Date | Buyer | Sale Price | Title Company |
|---|---|---|---|
| Jabaay Jeremy E | -- | None Listed On Document | |
| Blink Allison | $40,000 | None Available | |
| Deutsche Bank National Trust Co | -- | None Available | |
| Mcgee Reginald L | -- | None Available | |
| Mcclain Lawanda | $114,000 | First American Title |
Source: Public Records
Mortgage History
| Date | Status | Borrower | Loan Amount |
|---|---|---|---|
| Previous Owner | Mcclain Lawanda | $107,899 |
Source: Public Records
Tax History Compared to Growth
Tax History
| Year | Tax Paid | Tax Assessment Tax Assessment Total Assessment is a certain percentage of the fair market value that is determined by local assessors to be the total taxable value of land and additions on the property. | Land | Improvement |
|---|---|---|---|---|
| 2024 | $6,881 | $15,551 | $3,360 | $12,191 |
| 2023 | $4,271 | $18,057 | $3,360 | $14,697 |
| 2022 | $4,271 | $14,295 | $2,880 | $11,415 |
| 2021 | $4,278 | $10,546 | $2,880 | $7,666 |
| 2020 | $4,157 | $10,546 | $2,880 | $7,666 |
| 2019 | $3,173 | $8,864 | $2,560 | $6,304 |
| 2018 | $3,096 | $8,864 | $2,560 | $6,304 |
| 2017 | $1,597 | $6,258 | $2,560 | $3,698 |
| 2016 | $1,305 | $4,904 | $2,400 | $2,504 |
| 2015 | $1,951 | $6,334 | $2,400 | $3,934 |
| 2014 | $1,937 | $6,334 | $2,400 | $3,934 |
| 2013 | $1,986 | $6,724 | $2,400 | $4,324 |
Source: Public Records
Map
Nearby Homes
- 509 E 161st Place
- 521 E 161st Place
- 519 E 161st St
- 16211 Joyce Cir
- 16083 School St
- 609 E 160th Place
- 664 E 163rd St
- 634 E 161st St
- 644 E 162nd St
- 16411 Claire Ln
- 618 E 159th Place
- 16037 Evans Ave
- 505 Betty Ln
- 16417 School St
- 16419 School St
- 429 E 164th Place
- 606 E 164th Place
- 16007 Cottage Grove Ave
- 131 E 163rd St Unit 16A
- 112 E 160th Place
- 459 E 161st Place
- 447 E 161st Place
- 463 E 161st Place
- 443 E 161st Place
- 467 E 161st Place
- 437 E 161st Place
- 433 E 161st Place
- 473 E 161st Place
- 456 E 161st Place
- 448 E 161st Place
- 448 E 161st Place
- 468 E 161st Place
- 502 E 162nd St
- 477 E 161st Place
- 444 E 161st Place
- 444 E 161st Place
- 438 E 161st Place
- 500 E 162nd St
- 429 E 161st Place
- 505 E 161st Place