
Landlord's Agent in 2023
Vicky Harris
William Raveis Real Estate
(203) 912-2708
3 in this area
25 Total Sales
Estimated Value: $700,000 - $858,000
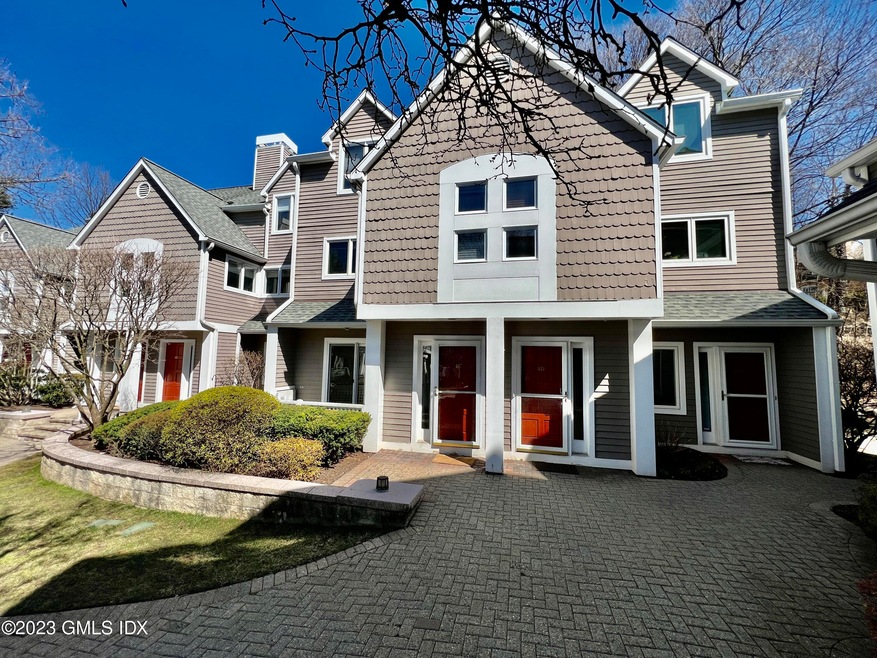
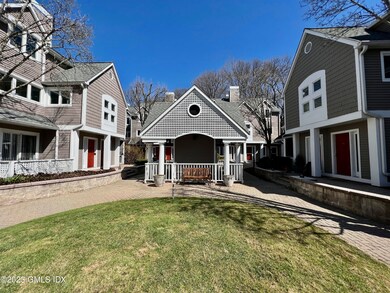
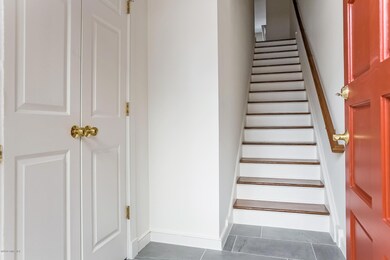
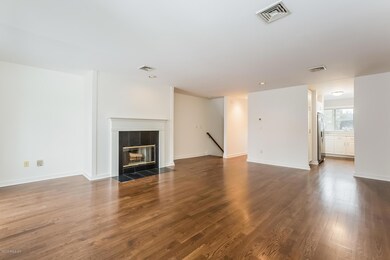
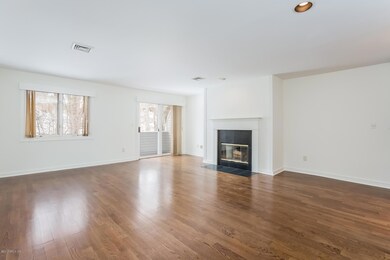
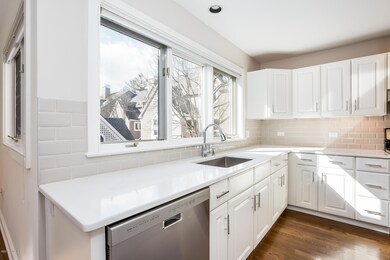
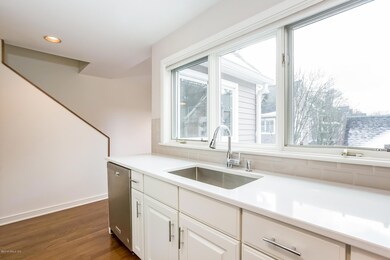
Renovated 2 bedroom, 2.5 bath townhouse in the center of Cos Cob. Crisp white kitchen with quartz countertops and stainless steel appliances. Spacious living room/dining room with fireplace, and spot for small office. Other highlights include hardwood floors throughout, updated bathrooms, central air, laundry, deck off living room and master bedroom and assigned parking for 2 cars in underground garage which has elevator to courtyard. Minutes to train, shops, restaurants! Floor plan attached. Good credit required.
Last Agent to Rent the Property
William Raveis Real Estate License #REB.0794796 Listed on: 03/20/2023
Last Renter's Agent
Victoria Harris
William Raveis Real Estate License #RES.0027379
| Date | Event | Price | List to Sale | Price per Sq Ft | Prior Sale |
|---|---|---|---|---|---|
| 03/25/2023 03/25/23 | Rented | $4,000 | -2.4% | -- | |
| 03/23/2023 03/23/23 | Under Contract | -- | -- | -- | |
| 03/19/2023 03/19/23 | For Rent | $4,100 | +13.9% | -- | |
| 11/20/2020 11/20/20 | Rented | $3,600 | -1.4% | -- | |
| 11/14/2020 11/14/20 | Under Contract | -- | -- | -- | |
| 11/01/2020 11/01/20 | For Rent | $3,650 | +5.8% | -- | |
| 03/27/2019 03/27/19 | Rented | $3,450 | -4.2% | -- | |
| 03/27/2019 03/27/19 | Under Contract | -- | -- | -- | |
| 02/11/2019 02/11/19 | For Rent | $3,600 | 0.0% | -- | |
| 12/06/2018 12/06/18 | Sold | $550,000 | -6.0% | $376 / Sq Ft | View Prior Sale |
| 11/16/2018 11/16/18 | Pending | -- | -- | -- | |
| 10/05/2018 10/05/18 | For Sale | $585,000 | -- | $400 / Sq Ft |
Landlord's Agent in 2023
Vicky Harris
William Raveis Real Estate
(203) 912-2708
3 in this area
25 Total Sales
V
Tenant's Agent in 2023
Victoria Harris
William Raveis Real Estate
H
Seller's Agent in 2018
Holly Hawes
Halstead Real Estate
Source: Greenwich Association of REALTORS®
MLS Number: 117782
APN: GREE M:08A B:1899/S
Disclaimer: Certain information contained herein is derived from information provided by parties other than Homes.com. All information provided is deemed reliable, but is not guaranteed to be accurate and should be independently verified.
![]() Listing data courtesy of Greenwich MLS. IDX information is provided exclusively for consumers’ personal, non-commercial use, that it may not be used for any purpose other than to
Listing data courtesy of Greenwich MLS. IDX information is provided exclusively for consumers’ personal, non-commercial use, that it may not be used for any purpose other than to
identify prospective properties consumers may be interested in purchasing. Data is deemed reliable but is not guaranteed accurate by the MLS.
Ask me questions while you tour the home.