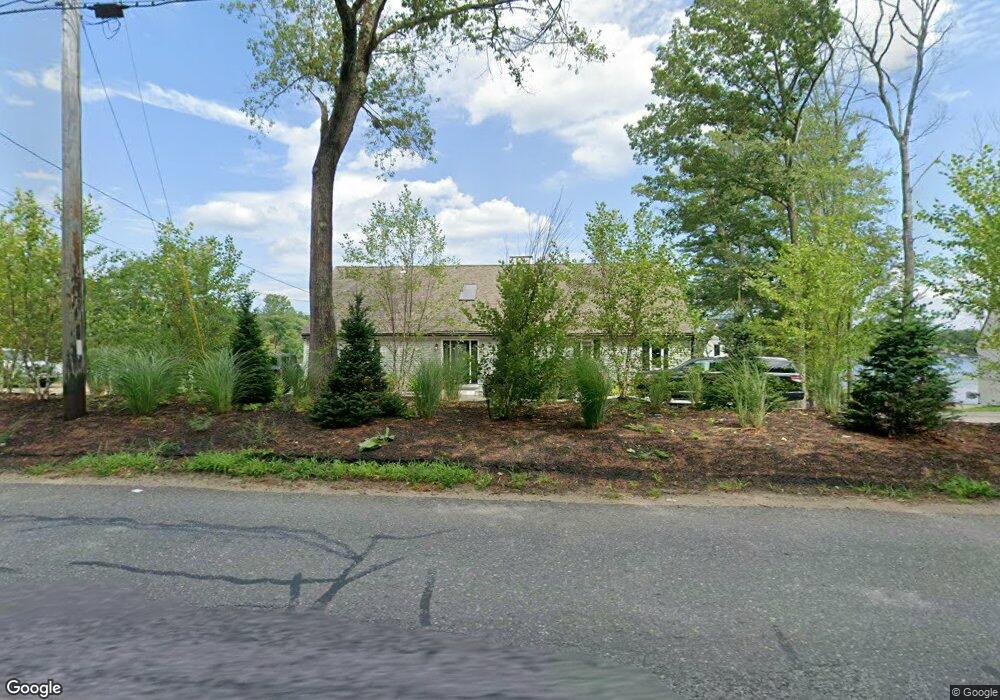
453 Glenallen St Winchendon, MA 01475
Estimated Value: $913,488 - $973,000
3
Beds
4
Baths
4,320
Sq Ft
$218/Sq Ft
Est. Value
About This Home
This home is located at 453 Glenallen St, Winchendon, MA 01475 and is currently estimated at $940,122, approximately $217 per square foot. 453 Glenallen St is a home located in Worcester County with nearby schools including Memorial, Toy Town Elementary School, and The Winchendon School.
Ownership History
Date
Name
Owned For
Owner Type
Purchase Details
Closed on
Jan 29, 2024
Sold by
Scott Christopher L and Raimo Kayla
Bought by
Vandyke Jamison B
Current Estimated Value
Home Financials for this Owner
Home Financials are based on the most recent Mortgage that was taken out on this home.
Original Mortgage
$574,000
Outstanding Balance
$563,422
Interest Rate
6.95%
Mortgage Type
Purchase Money Mortgage
Estimated Equity
$376,700
Purchase Details
Closed on
Dec 8, 2022
Sold by
Scott Rt and Scott
Bought by
Scott Christopher L and Raimo Kayla
Home Financials for this Owner
Home Financials are based on the most recent Mortgage that was taken out on this home.
Original Mortgage
$536,000
Interest Rate
7.08%
Mortgage Type
New Conventional
Purchase Details
Closed on
Jul 20, 2022
Sold by
Scott Christopher L and Page Naomi S
Bought by
Scott Rt and Scott
Purchase Details
Closed on
Apr 29, 1997
Sold by
Porter Michael J
Bought by
Scott Christopher L and Page Naomi
Create a Home Valuation Report for This Property
The Home Valuation Report is an in-depth analysis detailing your home's value as well as a comparison with similar homes in the area
Home Values in the Area
Average Home Value in this Area
Purchase History
| Date | Buyer | Sale Price | Title Company |
|---|---|---|---|
| Vandyke Jamison B | $820,000 | None Available | |
| Vandyke Jamison B | $820,000 | None Available | |
| Vandyke Jamison B | $820,000 | None Available | |
| Scott Christopher L | -- | None Available | |
| Scott Christopher L | -- | None Available | |
| Scott Christopher L | -- | None Available | |
| Scott Rt | -- | None Available | |
| Scott Rt | -- | None Available | |
| Scott Rt | -- | None Available | |
| Scott Christopher L | $150,000 | -- | |
| Scott Christopher L | $150,000 | -- |
Source: Public Records
Mortgage History
| Date | Status | Borrower | Loan Amount |
|---|---|---|---|
| Open | Vandyke Jamison B | $574,000 | |
| Closed | Vandyke Jamison B | $574,000 | |
| Previous Owner | Scott Christopher L | $536,000 | |
| Previous Owner | Scott Christopher L | $150,000 |
Source: Public Records
Tax History Compared to Growth
Tax History
| Year | Tax Paid | Tax Assessment Tax Assessment Total Assessment is a certain percentage of the fair market value that is determined by local assessors to be the total taxable value of land and additions on the property. | Land | Improvement |
|---|---|---|---|---|
| 2025 | $9,588 | $816,040 | $271,900 | $544,140 |
| 2024 | $9,502 | $757,710 | $261,900 | $495,810 |
| 2023 | $9,422 | $703,160 | $248,800 | $454,360 |
| 2022 | $8,651 | $572,550 | $248,700 | $323,850 |
| 2021 | $8,163 | $519,250 | $226,000 | $293,250 |
| 2020 | $8,232 | $505,660 | $215,200 | $290,460 |
| 2019 | $7,811 | $467,420 | $196,400 | $271,020 |
| 2018 | $7,531 | $434,090 | $174,600 | $259,490 |
| 2017 | $7,357 | $409,430 | $163,800 | $245,630 |
| 2016 | $6,661 | $382,160 | $148,500 | $233,660 |
| 2015 | $6,390 | $382,160 | $148,500 | $233,660 |
| 2014 | $6,454 | $404,380 | $179,000 | $225,380 |
Source: Public Records
Map
Nearby Homes
- 19 Monomonac Terrace
- 0 Monomonac Rd W
- 40 Maple Dr
- 16 2nd St
- 35 Hillside Dr
- 28 Wellington Rd
- 0 Glenallen St
- 15 Colonial Ln
- 11 Colonial Ln
- Lot 2 Saybrook Dr
- Lot 15-0 Saybrook Dr
- Lot 1 Saybrook Dr
- Lot 14 Saybrook Dr
- 41 Peggi Ln
- 0 Vaine St
- 24 Vaine St
- 71 Woodlawn St
- 108 Highland St
- 29 Winter St
- 33 East St
- 459 Glenallen St
- 449 Glenallen St
- 456 Glenallen St
- 452 Glenallen St
- 463 Glenallen St
- 464 Glenallen St
- 448 Glenallen St
- 468 Glenallen St
- 0 Route 202
- 18 Marina Way
- 10 Marina Way
- 12 Marina Way
- 385 Glenallen St
- Lot 9 Sarina Way Unit Lot 9
- Lot 11 Sarina Way Unit Lot 11
- Lot 10 Sarina Way Unit Lot 10
- Lot 5 Sarina Way Unit Lot 5
- Lot 8 Sarina Way Unit Lot 8
- Lot 7 Sarina Way Unit Lot 7
- Lot 1 Sarina Way Unit Lot 1