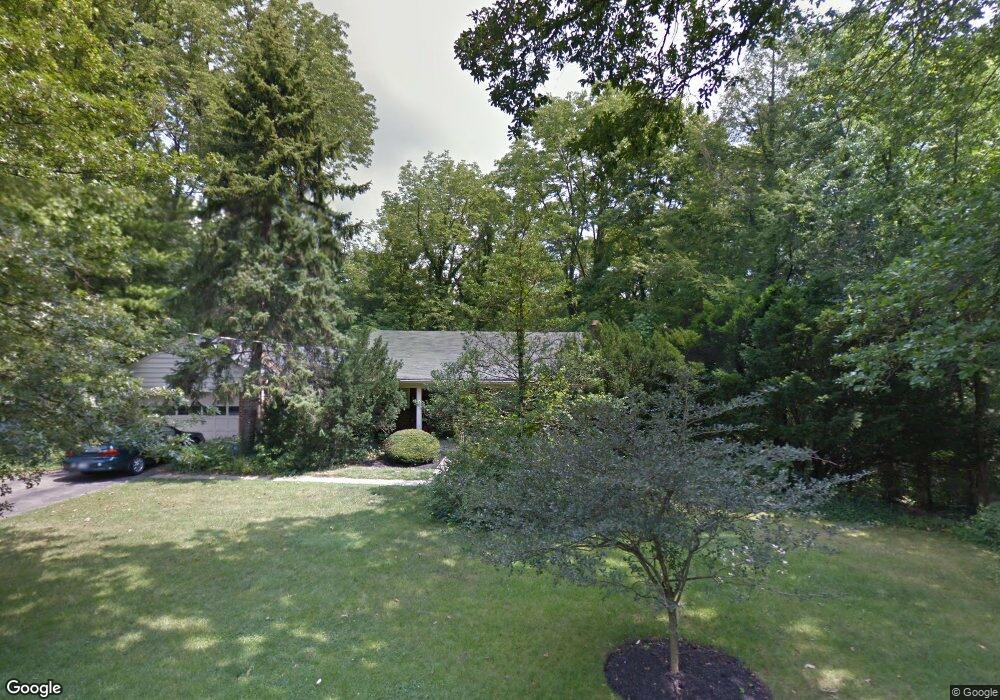
453 Hidden Valley Ln Cincinnati, OH 45215
Estimated Value: $392,793 - $460,000
3
Beds
2
Baths
1,362
Sq Ft
$313/Sq Ft
Est. Value
About This Home
This home is located at 453 Hidden Valley Ln, Cincinnati, OH 45215 and is currently estimated at $425,698, approximately $312 per square foot. 453 Hidden Valley Ln is a home located in Hamilton County with nearby schools including Wyoming High School and John Paul II Catholic School.
Ownership History
Date
Name
Owned For
Owner Type
Purchase Details
Closed on
Apr 22, 2017
Sold by
Pease Charles H and Pease Tara S
Bought by
Pease Tara S
Current Estimated Value
Purchase Details
Closed on
May 1, 1994
Sold by
Yeager Ida Marie
Bought by
Pease Charles H and Pease Tara S
Home Financials for this Owner
Home Financials are based on the most recent Mortgage that was taken out on this home.
Original Mortgage
$138,100
Interest Rate
7.88%
Create a Home Valuation Report for This Property
The Home Valuation Report is an in-depth analysis detailing your home's value as well as a comparison with similar homes in the area
Home Values in the Area
Average Home Value in this Area
Purchase History
| Date | Buyer | Sale Price | Title Company |
|---|---|---|---|
| Pease Tara S | -- | None Available | |
| Pease Charles H | -- | -- |
Source: Public Records
Mortgage History
| Date | Status | Borrower | Loan Amount |
|---|---|---|---|
| Closed | Pease Charles H | $138,100 |
Source: Public Records
Tax History
| Year | Tax Paid | Tax Assessment Tax Assessment Total Assessment is a certain percentage of the fair market value that is determined by local assessors to be the total taxable value of land and additions on the property. | Land | Improvement |
|---|---|---|---|---|
| 2025 | $6,838 | $112,375 | $41,692 | $70,683 |
| 2024 | $6,675 | $112,375 | $41,692 | $70,683 |
| 2023 | $6,154 | $112,375 | $41,692 | $70,683 |
| 2022 | $6,733 | $99,411 | $43,967 | $55,444 |
| 2021 | $6,560 | $99,411 | $43,967 | $55,444 |
| 2020 | $6,711 | $99,411 | $43,967 | $55,444 |
| 2019 | $6,259 | $85,698 | $37,902 | $47,796 |
| 2018 | $6,262 | $85,698 | $37,902 | $47,796 |
| 2017 | $5,995 | $85,698 | $37,902 | $47,796 |
| 2016 | $5,475 | $90,433 | $37,170 | $53,263 |
| 2015 | $5,539 | $90,433 | $37,170 | $53,263 |
| 2014 | $5,553 | $90,433 | $37,170 | $53,263 |
| 2013 | $5,373 | $83,735 | $34,416 | $49,319 |
Source: Public Records
Map
Nearby Homes
- 513 Chisholm Trail
- 419 Reily Rd
- 350 Pleasant Hill Dr
- 204 Brocdorf Dr
- 320 Reily Rd
- 429 Mccreary Ct
- 1012 Mary Ln
- 9441 Wyoming Point Place
- 357 Meadowcrest Rd
- 311 Ritchie Ave
- 343 Ashley Ln
- 9469 Beech Dr
- 206 Hilltop Ln
- 9197 Long Ln
- 8674 Hollyhock Dr
- 650 Allencrest Ct
- 722 Compton Rd
- 155 Bonham Rd
- 8415 Mayfair St
- 399 W Galbraith Rd
- 451 Hidden Valley Ln
- 459 Hidden Valley Ln
- 450 Hidden Valley Ln
- 456 Hidden Valley Ln
- 449 Hidden Valley Ln
- 460 Hidden Valley Ln
- 444 Hidden Valley Ln
- 904 Oregon Trail
- 542 Woodbrook Ln
- 440 Hidden Valley Ln
- 546 Woodbrook Ln
- 902 Oregon Trail
- 439 Hidden Valley Ln
- 434 Hidden Valley Ln
- 426 Hidden Valley Ln
- 548 Woodbrook Ln
- 437 Hidden Valley Ln
- 906 Oregon Trail
- 550 Woodbrook Ln
- 428 Hidden Valley Ln
Your Personal Tour Guide
Ask me questions while you tour the home.