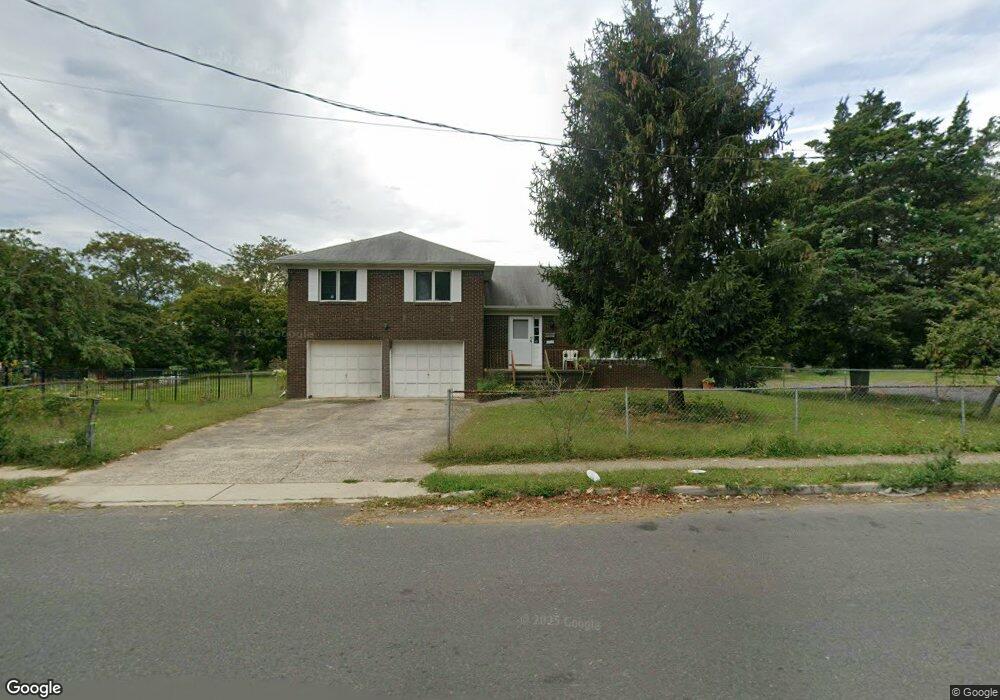
453 High St Long Branch, NJ 07740
Estimated Value: $690,000 - $842,483
3
Beds
2
Baths
2,544
Sq Ft
$305/Sq Ft
Est. Value
About This Home
This home is located at 453 High St, Long Branch, NJ 07740 and is currently estimated at $775,621, approximately $304 per square foot. 453 High St is a home located in Monmouth County with nearby schools including Long Branch High School, Holy Trinity School, and Bet Yaakov of the Jersey Shore.
Ownership History
Date
Name
Owned For
Owner Type
Purchase Details
Closed on
Oct 14, 2021
Sold by
Cuppari Elizabeth and Cuppari Guiseppe
Bought by
Cuppari Paul J and Cuppari Elizabeth
Current Estimated Value
Purchase Details
Closed on
May 26, 2011
Sold by
Cuppari Guiseppe and Cuppari Elizabeth
Bought by
Cuppari Guiseppe and Cuppari Elisabetta
Home Financials for this Owner
Home Financials are based on the most recent Mortgage that was taken out on this home.
Original Mortgage
$88,000
Interest Rate
3.68%
Mortgage Type
New Conventional
Create a Home Valuation Report for This Property
The Home Valuation Report is an in-depth analysis detailing your home's value as well as a comparison with similar homes in the area
Home Values in the Area
Average Home Value in this Area
Purchase History
| Date | Buyer | Sale Price | Title Company |
|---|---|---|---|
| Cuppari Paul J | -- | None Available | |
| Cuppari Guiseppe | -- | East Coast Title Svcs Llc |
Source: Public Records
Mortgage History
| Date | Status | Borrower | Loan Amount |
|---|---|---|---|
| Closed | Cuppari Guiseppe | $88,000 |
Source: Public Records
Tax History Compared to Growth
Tax History
| Year | Tax Paid | Tax Assessment Tax Assessment Total Assessment is a certain percentage of the fair market value that is determined by local assessors to be the total taxable value of land and additions on the property. | Land | Improvement |
|---|---|---|---|---|
| 2025 | $9,104 | $665,900 | $237,100 | $428,800 |
| 2024 | $8,753 | $592,300 | $182,100 | $410,200 |
| 2023 | $8,753 | $563,600 | $172,100 | $391,500 |
| 2022 | $7,850 | $472,400 | $127,500 | $344,900 |
| 2021 | $7,850 | $442,100 | $119,500 | $322,600 |
| 2020 | $8,949 | $428,200 | $107,500 | $320,700 |
| 2019 | $8,646 | $411,300 | $105,500 | $305,800 |
| 2018 | $8,974 | $424,500 | $103,500 | $321,000 |
| 2017 | $8,561 | $415,400 | $100,500 | $314,900 |
| 2016 | $8,272 | $409,300 | $102,500 | $306,800 |
| 2015 | $9,217 | $425,100 | $111,400 | $313,700 |
| 2014 | $8,255 | $402,500 | $124,100 | $278,400 |
Source: Public Records
Map
Nearby Homes
- 364 Westwood Ave Unit 39
- 364 Westwood Ave Unit 71
- 364 Westwood Ave Unit 21
- 298 Poole Ave
- 377 Westwood Ave
- 303 Westwood Ave
- 434 Westwood Ave
- 215 Cleveland Ave
- 399 Willow Ave
- 440 W End Ave
- 88 Norwood Ave
- 369 Indiana Ave
- 23 Woolley Ave
- 264 Norwood Ave
- 28 Norwood Ave
- 237 3rd Ave Unit 1-4
- 279 W West End Ave
- 552 Westwood Ave
- 317 Norwood Ave
- 144 Westwood Ave
- 455 High St
- 461 High St
- 450 High St
- 448 High St
- 354 Bath Ave
- 452 High St
- 463 High St
- 465 High St
- 458 High St
- 467 High St
- 344 Bath Ave
- 446 High St
- 477 High St
- 377 Waverly Place
- 349 Eastbourne Ave
- 349 Eastbourne Ave Unit WINTER
- 349 Eastbourne Ave Unit ANNUAL
- 349 Eastbourne Ave Unit SUMMER
- 355 Eastbourne Ave
- 379 Waverly Place