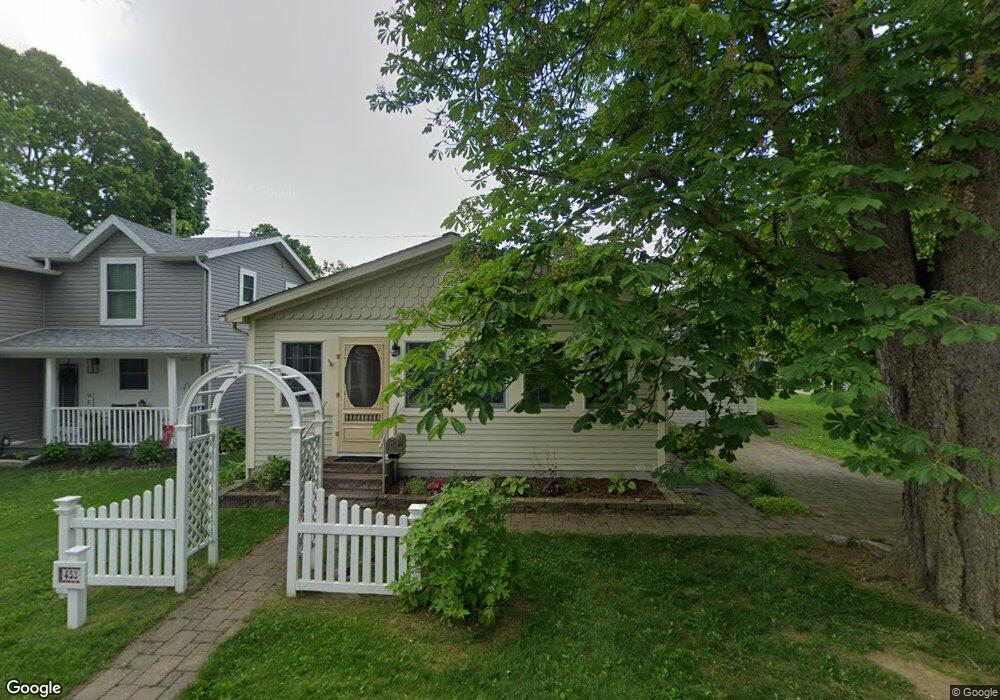
453 Lynn Ave Lakeside Marblehead, OH 43440
Estimated Value: $424,664 - $519,000
2
Beds
1
Bath
896
Sq Ft
$535/Sq Ft
Est. Value
About This Home
This home is located at 453 Lynn Ave, Lakeside Marblehead, OH 43440 and is currently estimated at $479,166, approximately $534 per square foot. 453 Lynn Ave is a home located in Ottawa County with nearby schools including Danbury Middle School and Danbury High School.
Ownership History
Date
Name
Owned For
Owner Type
Purchase Details
Closed on
May 26, 2020
Sold by
Bishop E Dennis E and Bishop Mary M
Bought by
Bishop Mary M and Mary M Bishop Family Trust
Current Estimated Value
Purchase Details
Closed on
Aug 31, 2015
Sold by
Kameya Mary Morris
Bought by
Bishop E Dennis & Mary M Trustees
Home Financials for this Owner
Home Financials are based on the most recent Mortgage that was taken out on this home.
Interest Rate
3.84%
Purchase Details
Closed on
Sep 24, 2001
Sold by
Gordon Carl E
Bought by
Kameya Mary M
Home Financials for this Owner
Home Financials are based on the most recent Mortgage that was taken out on this home.
Original Mortgage
$93,600
Interest Rate
7.06%
Mortgage Type
New Conventional
Create a Home Valuation Report for This Property
The Home Valuation Report is an in-depth analysis detailing your home's value as well as a comparison with similar homes in the area
Home Values in the Area
Average Home Value in this Area
Purchase History
| Date | Buyer | Sale Price | Title Company |
|---|---|---|---|
| Bishop Mary M | -- | None Available | |
| Bishop E Dennis & Mary M Trustees | -- | -- | |
| Kameya Mary M | $117,000 | -- |
Source: Public Records
Mortgage History
| Date | Status | Borrower | Loan Amount |
|---|---|---|---|
| Closed | Bishop E Dennis & Mary M Trustees | -- | |
| Previous Owner | Kameya Mary M | $93,600 |
Source: Public Records
Tax History Compared to Growth
Tax History
| Year | Tax Paid | Tax Assessment Tax Assessment Total Assessment is a certain percentage of the fair market value that is determined by local assessors to be the total taxable value of land and additions on the property. | Land | Improvement |
|---|---|---|---|---|
| 2024 | $4,419 | $129,665 | $60,921 | $68,744 |
| 2023 | $4,419 | $89,198 | $33,544 | $55,654 |
| 2022 | $3,079 | $89,198 | $33,544 | $55,654 |
| 2021 | $3,088 | $89,190 | $33,540 | $55,650 |
| 2020 | $2,683 | $73,320 | $32,890 | $40,430 |
| 2019 | $2,482 | $73,320 | $32,890 | $40,430 |
| 2018 | $2,524 | $73,320 | $32,890 | $40,430 |
| 2017 | $2,254 | $64,680 | $30,720 | $33,960 |
| 2016 | $2,232 | $64,680 | $30,720 | $33,960 |
| 2015 | $2,241 | $64,680 | $30,720 | $33,960 |
| 2014 | $899 | $51,750 | $21,070 | $30,680 |
| 2013 | $834 | $51,750 | $21,070 | $30,680 |
Source: Public Records
Map
Nearby Homes