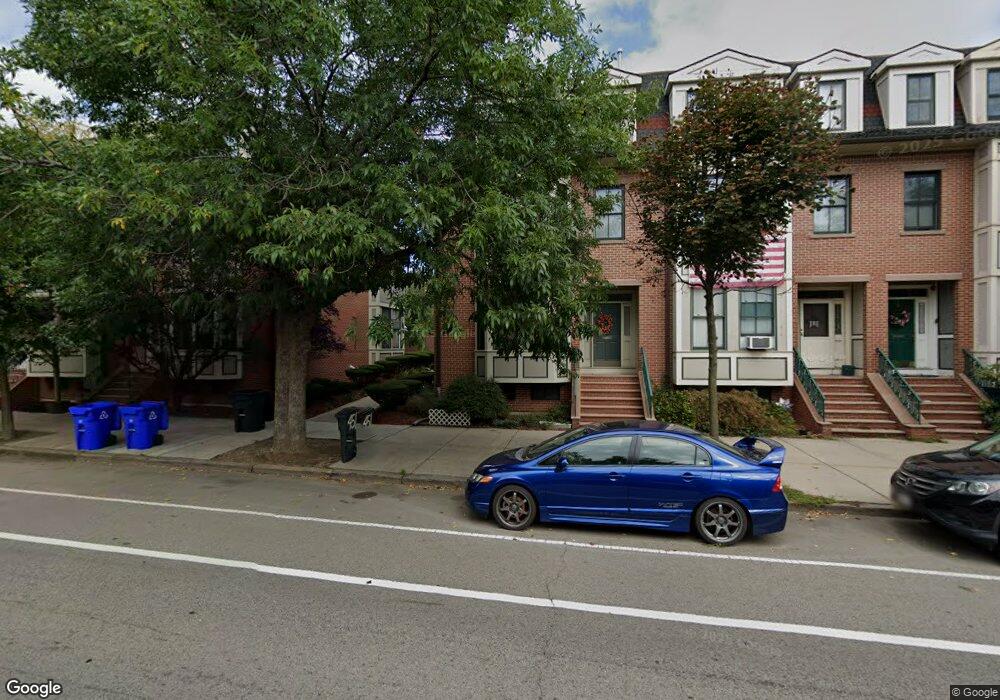
453 Main St Charlestown, MA 02129
Medford Street-The Neck NeighborhoodEstimated Value: $1,667,000 - $2,306,094
3
Beds
3
Baths
2,107
Sq Ft
$910/Sq Ft
Est. Value
About This Home
This home is located at 453 Main St, Charlestown, MA 02129 and is currently estimated at $1,917,774, approximately $910 per square foot. 453 Main St is a home located in Suffolk County with nearby schools including Torit Montessori School and Malden Catholic.
Ownership History
Date
Name
Owned For
Owner Type
Purchase Details
Closed on
Aug 26, 2002
Sold by
Charles St Gdns Llc
Bought by
Cheung Kwok S and Cheung Ya L
Current Estimated Value
Home Financials for this Owner
Home Financials are based on the most recent Mortgage that was taken out on this home.
Original Mortgage
$150,000
Interest Rate
6.57%
Mortgage Type
Purchase Money Mortgage
Create a Home Valuation Report for This Property
The Home Valuation Report is an in-depth analysis detailing your home's value as well as a comparison with similar homes in the area
Home Values in the Area
Average Home Value in this Area
Purchase History
| Date | Buyer | Sale Price | Title Company |
|---|---|---|---|
| Cheung Kwok S | $588,485 | -- |
Source: Public Records
Mortgage History
| Date | Status | Borrower | Loan Amount |
|---|---|---|---|
| Open | Cheung Kwok S | $130,000 | |
| Closed | Cheung Kwok S | $150,000 |
Source: Public Records
Tax History Compared to Growth
Tax History
| Year | Tax Paid | Tax Assessment Tax Assessment Total Assessment is a certain percentage of the fair market value that is determined by local assessors to be the total taxable value of land and additions on the property. | Land | Improvement |
|---|---|---|---|---|
| 2025 | $18,101 | $1,563,100 | $478,800 | $1,084,300 |
| 2024 | $16,374 | $1,502,200 | $360,700 | $1,141,500 |
| 2023 | $15,367 | $1,430,800 | $343,600 | $1,087,200 |
| 2022 | $14,030 | $1,289,500 | $312,300 | $977,200 |
| 2021 | $13,489 | $1,264,200 | $306,200 | $958,000 |
| 2020 | $11,816 | $1,118,900 | $300,500 | $818,400 |
| 2019 | $11,556 | $1,096,400 | $241,600 | $854,800 |
| 2018 | $10,844 | $1,034,700 | $241,600 | $793,100 |
| 2017 | $10,142 | $957,700 | $241,600 | $716,100 |
| 2016 | $9,879 | $898,100 | $240,400 | $657,700 |
| 2015 | $9,580 | $791,100 | $193,800 | $597,300 |
| 2014 | $8,783 | $698,200 | $193,800 | $504,400 |
Source: Public Records
Map
Nearby Homes
- 9 Armory St
- 9 Short St
- 100 Baldwin St Unit 1
- 364 Bunker Hill St Unit 1
- 40 Chappie St Unit 1
- 24 N Mead St
- 29 Eden St Unit 3
- 64 Walker St Unit 66
- 56 Belmont St Unit 1
- 270 Bunker Hill St Unit 4
- 15 Russell St
- 255 Bunker Hill St Unit 2
- 24 Brighton St
- 9 Russell St Unit 2
- 9 Russell St Unit 1
- 19 Parker St Unit 3
- 39 Mount Pleasant St
- 207 Bunker Hill St Unit 2
- 254-256 Medford St Unit 2
- 7 Washington St
- 451 Main St
- 455 Main St
- 449 Main St
- 457 Main St
- 447 Main St
- 459 Main St
- 445 Main St
- 445 Main St Unit 3
- 445 Main St Unit 2
- 445 Main St Unit 1
- 461 Main St
- 461 Main St Unit TH
- 445 Main St Unit 3
- 445 Main St Unit 1
- 443 Main St Unit 3
- 443 Main St Unit 2
- 443 Main St Unit 1
- 452 Main St Unit 2
- 452 Main St Unit 1
- 452 Main St