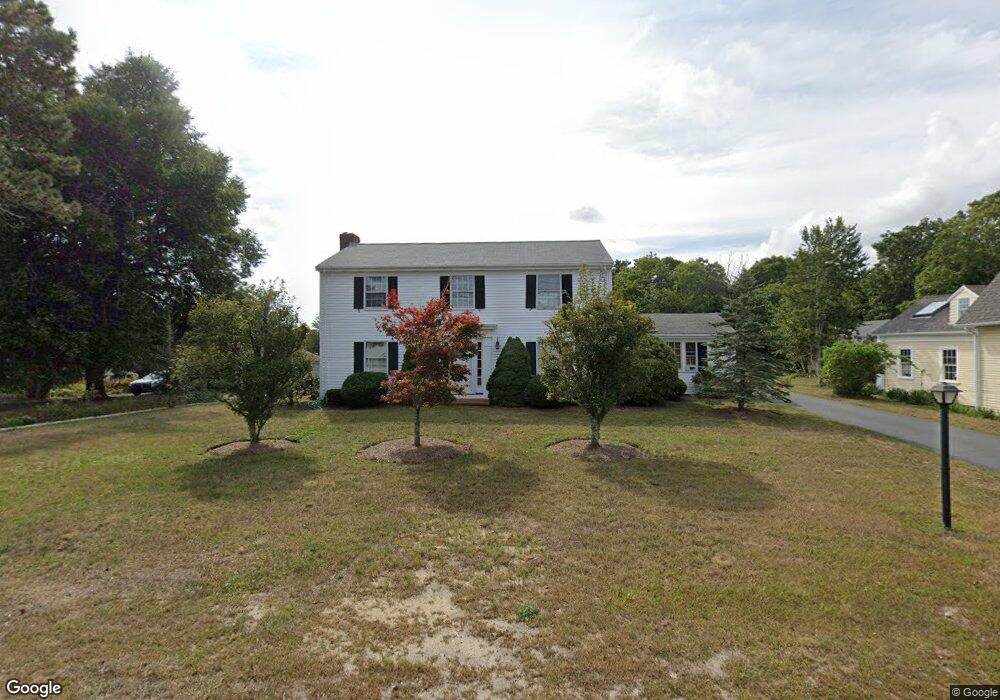
453 Main St Dennis Port, MA 2639
Dennis Port NeighborhoodEstimated Value: $684,122 - $739,000
4
Beds
2
Baths
1,980
Sq Ft
$362/Sq Ft
Est. Value
About This Home
This home is located at 453 Main St, Dennis Port, MA 2639 and is currently estimated at $717,531, approximately $362 per square foot. 453 Main St is a home located in Barnstable County with nearby schools including Dennis-Yarmouth Regional High School and St. Pius X. School.
Ownership History
Date
Name
Owned For
Owner Type
Purchase Details
Closed on
Feb 10, 2022
Sold by
Ricciardi Douglas and Ricciardi Christine
Bought by
Ricciardi Ft
Current Estimated Value
Purchase Details
Closed on
Dec 15, 1994
Sold by
Burns Rita J Est
Bought by
Ricciardi Douglas and Ricciardi Christine
Create a Home Valuation Report for This Property
The Home Valuation Report is an in-depth analysis detailing your home's value as well as a comparison with similar homes in the area
Home Values in the Area
Average Home Value in this Area
Purchase History
| Date | Buyer | Sale Price | Title Company |
|---|---|---|---|
| Ricciardi Ft | -- | None Available | |
| Ricciardi Douglas | $130,000 | -- |
Source: Public Records
Mortgage History
| Date | Status | Borrower | Loan Amount |
|---|---|---|---|
| Previous Owner | Ricciardi Douglas | $206,000 | |
| Previous Owner | Ricciardi Douglas | $100,000 | |
| Previous Owner | Ricciardi Douglas | $197,000 | |
| Previous Owner | Ricciardi Douglas | $200,000 |
Source: Public Records
Tax History Compared to Growth
Tax History
| Year | Tax Paid | Tax Assessment Tax Assessment Total Assessment is a certain percentage of the fair market value that is determined by local assessors to be the total taxable value of land and additions on the property. | Land | Improvement |
|---|---|---|---|---|
| 2025 | $2,528 | $583,800 | $184,500 | $399,300 |
| 2024 | $2,550 | $580,900 | $177,500 | $403,400 |
| 2023 | $2,457 | $526,200 | $161,300 | $364,900 |
| 2022 | $2,337 | $417,300 | $145,300 | $272,000 |
| 2021 | $2,235 | $370,700 | $142,500 | $228,200 |
| 2020 | $2,118 | $347,200 | $142,500 | $204,700 |
| 2019 | $2,094 | $339,400 | $139,700 | $199,700 |
| 2018 | $1,792 | $282,700 | $108,800 | $173,900 |
| 2017 | $1,739 | $282,700 | $108,800 | $173,900 |
| 2016 | $1,816 | $278,100 | $133,000 | $145,100 |
| 2015 | $1,780 | $278,100 | $133,000 | $145,100 |
| 2014 | $1,831 | $288,300 | $133,000 | $155,300 |
Source: Public Records
Map
Nearby Homes
- 10 Candlewood Ln Unit 2-1
- 12 Candlewood Ln Unit 2-9
- 12 Cross St
- 9 Country Ln
- 166 Upper County Rd Unit 1-4
- 221 Upper County Rd Unit 2A
- 221 Upper County Rd Unit 2A
- 268 Main St
- 72 Bassett Ln
- 159 Center St Unit 22
- 47 Telegraph Rd Unit 1
- 26 Manning Rd
- 22 Wixon Rd
- 78 Upper County Rd Unit A&B
- 78 Upper County Rd
- 73 Division St
- 24 Indian Trail
- 141 Division St
- 141 Division St
- 125 Main St Unit 3
- 435 Massachusetts 28
- 435 Massachusetts 28 Unit 1
- 461 Main St
- 441 Main St
- 422 Massachusetts 28
- 471 Main St
- 451 Main St Unit 5
- 451 Main St Unit 4
- 451 Main St Unit 1
- 451 Main St Unit 2
- 451 Main St Unit 3
- 435 Main St
- 435 Main St
- 435 Main St Unit A
- 435 Main St Unit B
- 444 Main St
- 447 Main St
- 477 Main St
- 425 Massachusetts 28
- 476 Main St