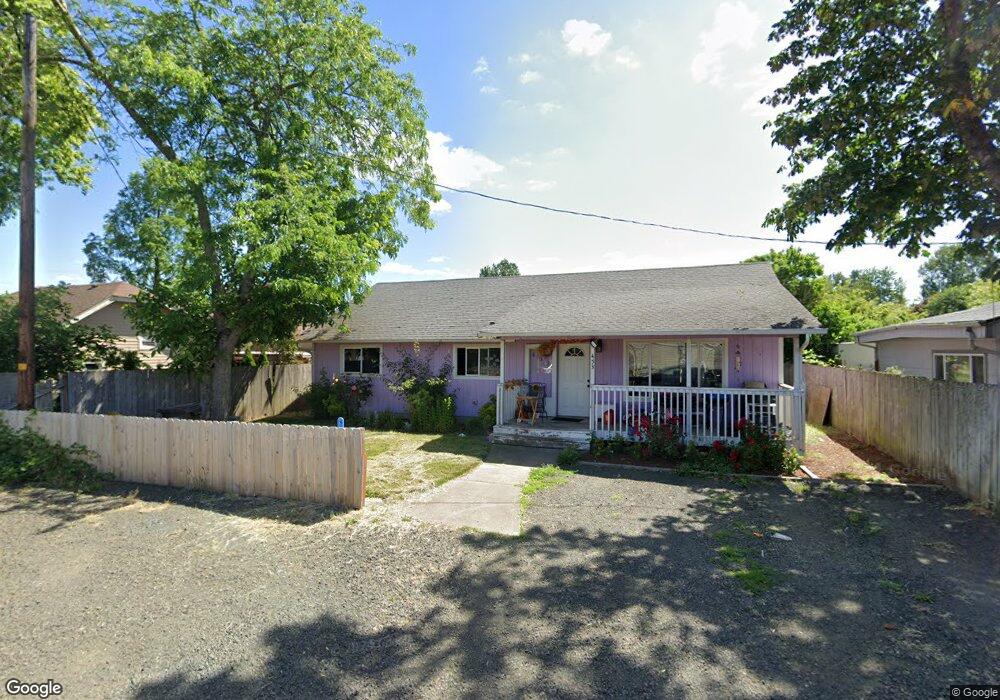
453 Marsh St Independence, OR 97351
Estimated Value: $370,000 - $416,000
3
Beds
2
Baths
1,344
Sq Ft
$290/Sq Ft
Est. Value
About This Home
This home is located at 453 Marsh St, Independence, OR 97351 and is currently estimated at $389,899, approximately $290 per square foot. 453 Marsh St is a home located in Polk County with nearby schools including Independence Elementary School, Talmadge Middle School, and Central High School.
Ownership History
Date
Name
Owned For
Owner Type
Purchase Details
Closed on
Aug 18, 2025
Sold by
Rodriguez Sherrie
Bought by
Rodriguez Sherrie
Current Estimated Value
Purchase Details
Closed on
Jan 7, 2022
Sold by
Thelma Waldron
Bought by
Rodriguez Severo and Rodriguez Sherrie
Home Financials for this Owner
Home Financials are based on the most recent Mortgage that was taken out on this home.
Original Mortgage
$275,742
Interest Rate
3.22%
Mortgage Type
FHA
Create a Home Valuation Report for This Property
The Home Valuation Report is an in-depth analysis detailing your home's value as well as a comparison with similar homes in the area
Home Values in the Area
Average Home Value in this Area
Purchase History
| Date | Buyer | Sale Price | Title Company |
|---|---|---|---|
| Rodriguez Sherrie | -- | None Listed On Document | |
| Rodriguez Severo | -- | First American Title |
Source: Public Records
Mortgage History
| Date | Status | Borrower | Loan Amount |
|---|---|---|---|
| Previous Owner | Rodriguez Severo | $275,742 |
Source: Public Records
Tax History
| Year | Tax Paid | Tax Assessment Tax Assessment Total Assessment is a certain percentage of the fair market value that is determined by local assessors to be the total taxable value of land and additions on the property. | Land | Improvement |
|---|---|---|---|---|
| 2025 | $2,465 | $140,180 | $27,570 | $112,610 |
| 2024 | $2,465 | $136,100 | $26,770 | $109,330 |
| 2023 | $2,528 | $132,140 | $25,990 | $106,150 |
| 2022 | $2,321 | $128,300 | $25,230 | $103,070 |
| 2021 | $2,296 | $124,570 | $24,500 | $100,070 |
| 2020 | $2,236 | $120,950 | $23,790 | $97,160 |
| 2019 | $2,178 | $117,430 | $23,090 | $94,340 |
| 2018 | $2,108 | $114,010 | $22,420 | $91,590 |
| 2017 | $2,096 | $110,690 | $21,770 | $88,920 |
| 2016 | $2,135 | $107,470 | $21,130 | $86,340 |
Source: Public Records
Map
Nearby Homes
Your Personal Tour Guide
Ask me questions while you tour the home.