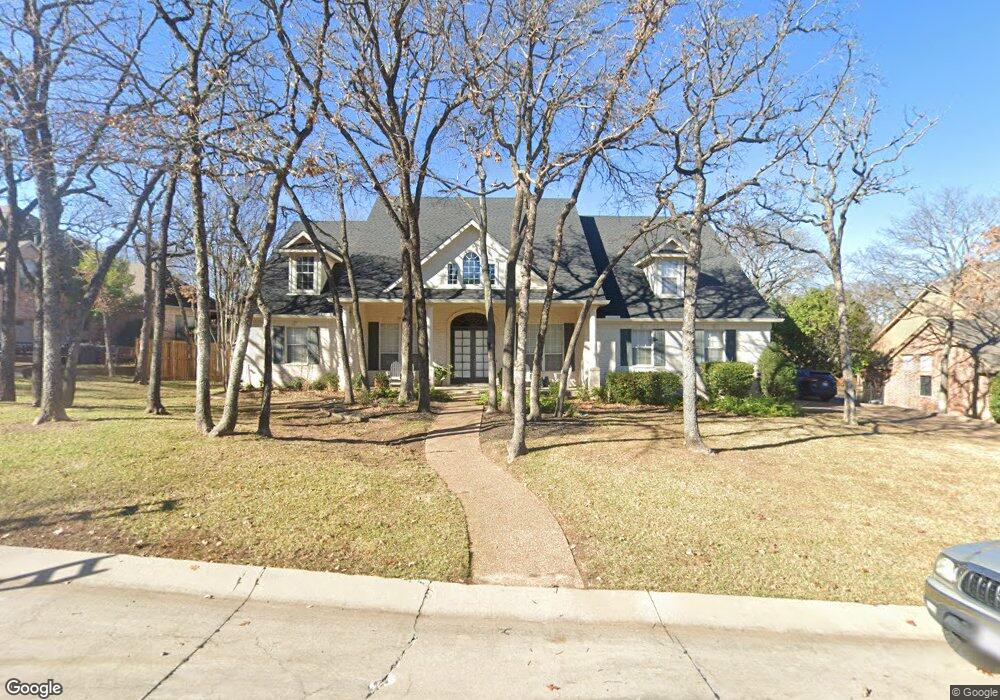
453 Marshall Rd Southlake, TX 76092
Estimated Value: $1,324,455 - $1,569,000
4
Beds
4
Baths
3,751
Sq Ft
$386/Sq Ft
Est. Value
About This Home
This home is located at 453 Marshall Rd, Southlake, TX 76092 and is currently estimated at $1,446,728, approximately $385 per square foot. 453 Marshall Rd is a home located in Tarrant County with nearby schools including Walnut Grove Elementary School, Don T. Durham Intermediate School, and Carroll Middle School.
Ownership History
Date
Name
Owned For
Owner Type
Purchase Details
Closed on
May 20, 2005
Sold by
Taunton Oscar David and Taunton Christie D
Bought by
Norman Ronald and Norman Nina
Current Estimated Value
Home Financials for this Owner
Home Financials are based on the most recent Mortgage that was taken out on this home.
Original Mortgage
$375,920
Outstanding Balance
$196,385
Interest Rate
5.87%
Mortgage Type
Fannie Mae Freddie Mac
Estimated Equity
$1,250,343
Purchase Details
Closed on
Jul 23, 1999
Sold by
Cadence Custom Homes
Bought by
Taunton Oscar David and Taunton Christie D
Home Financials for this Owner
Home Financials are based on the most recent Mortgage that was taken out on this home.
Original Mortgage
$303,750
Interest Rate
7.62%
Create a Home Valuation Report for This Property
The Home Valuation Report is an in-depth analysis detailing your home's value as well as a comparison with similar homes in the area
Home Values in the Area
Average Home Value in this Area
Purchase History
| Date | Buyer | Sale Price | Title Company |
|---|---|---|---|
| Norman Ronald | -- | Metroplex Title Inc | |
| Taunton Oscar David | -- | Commonwealth Land Title |
Source: Public Records
Mortgage History
| Date | Status | Borrower | Loan Amount |
|---|---|---|---|
| Open | Norman Ronald | $375,920 | |
| Previous Owner | Taunton Oscar David | $303,750 | |
| Closed | Taunton Oscar David | $81,000 |
Source: Public Records
Tax History Compared to Growth
Tax History
| Year | Tax Paid | Tax Assessment Tax Assessment Total Assessment is a certain percentage of the fair market value that is determined by local assessors to be the total taxable value of land and additions on the property. | Land | Improvement |
|---|---|---|---|---|
| 2025 | $14,146 | $903,263 | $297,975 | $605,288 |
| 2024 | $14,146 | $1,079,554 | $297,975 | $781,579 |
| 2023 | $16,449 | $1,083,178 | $297,975 | $785,203 |
| 2022 | $17,699 | $962,796 | $198,650 | $764,146 |
| 2021 | $17,005 | $745,822 | $198,650 | $547,172 |
| 2020 | $15,771 | $686,105 | $178,785 | $507,320 |
| 2019 | $15,627 | $645,337 | $175,000 | $470,337 |
| 2018 | $15,921 | $697,469 | $175,000 | $522,469 |
| 2017 | $17,026 | $719,451 | $175,000 | $544,451 |
| 2016 | $15,478 | $645,946 | $175,000 | $470,946 |
| 2015 | $13,740 | $567,700 | $95,000 | $472,700 |
| 2014 | $13,740 | $567,700 | $95,000 | $472,700 |
Source: Public Records
Map
Nearby Homes
- 517 Round Hollow Ln
- 2803 Tyler St
- 415 Marshall Rd
- 136 Sweet St
- 200 Murphy Dr
- 2201 Shady Oaks Dr
- 112 Murphy Dr
- 904 Charleston Dr
- 5 W Dove Rd
- 3240 Woodland Dr
- 1052 W Dove Rd
- 1825 Terra Bella Dr
- 3179 Southlake Park Rd
- 935 W Dove Rd
- 2009 Wheeler Dr
- 1785 Terra Bella Dr
- 2112 Beaver Creek Ln
- 3333 Southlake Park Rd
- 1900 Shady Oaks Dr
- 3600 Iron Mountain Ranch Ct
- 455 Marshall Rd
- 451 Marshall Rd
- 509 Round Hollow Ln
- 505 Round Hollow Ln
- 452 Marshall Rd
- 450 Marshall Rd
- 449 Marshall Rd
- 2814 Tyler St
- 448 Marshall Rd
- 2816 Tyler St
- 513 Round Hollow Ln
- 454 Marshall Rd
- 456 Marshall Rd
- 2806 Linden Ln
- 446 Marshall Rd
- 447 Marshall Rd
- 2808 Linden Ln
- 2804 Linden Ln
- 508 Round Hollow Ln
- 512 Round Hollow Ln