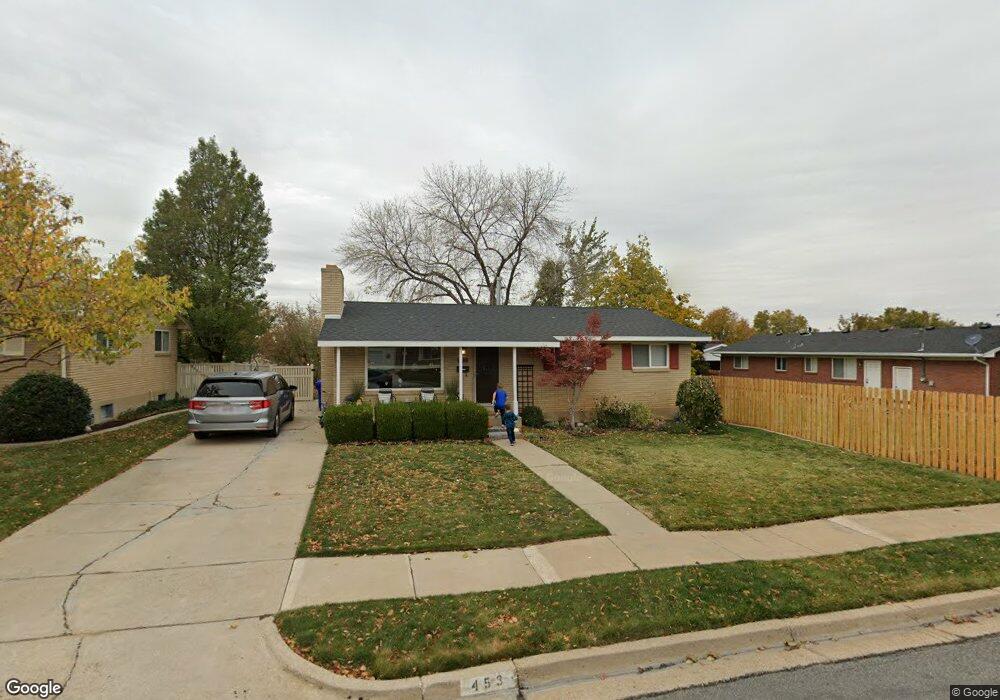
453 N 275 E Bountiful, UT 84010
Estimated Value: $453,000 - $519,000
4
Beds
2
Baths
2,106
Sq Ft
$228/Sq Ft
Est. Value
About This Home
This home is located at 453 N 275 E, Bountiful, UT 84010 and is currently estimated at $480,948, approximately $228 per square foot. 453 N 275 E is a home located in Davis County with nearby schools including Tolman School, Bountiful Junior High School, and Viewmont High School.
Ownership History
Date
Name
Owned For
Owner Type
Purchase Details
Closed on
Dec 20, 2011
Sold by
West Glen and West Kristine
Bought by
Lucero Gabriel J and Lucero Sarah A
Current Estimated Value
Home Financials for this Owner
Home Financials are based on the most recent Mortgage that was taken out on this home.
Original Mortgage
$121,600
Outstanding Balance
$82,782
Interest Rate
3.91%
Mortgage Type
New Conventional
Estimated Equity
$398,166
Purchase Details
Closed on
Feb 5, 2007
Sold by
West Glen
Bought by
West Glen and West Kristine
Home Financials for this Owner
Home Financials are based on the most recent Mortgage that was taken out on this home.
Original Mortgage
$232,750
Interest Rate
7.8%
Mortgage Type
New Conventional
Purchase Details
Closed on
Mar 25, 1999
Sold by
Thompson Michael C and Thompson Michelle W
Bought by
West Glen and West Kristine
Home Financials for this Owner
Home Financials are based on the most recent Mortgage that was taken out on this home.
Original Mortgage
$134,900
Interest Rate
6.73%
Create a Home Valuation Report for This Property
The Home Valuation Report is an in-depth analysis detailing your home's value as well as a comparison with similar homes in the area
Purchase History
| Date | Buyer | Sale Price | Title Company |
|---|---|---|---|
| Lucero Gabriel J | -- | Monument Title Ins I | |
| West Glen | -- | Inwest Title Services Inc | |
| West Glen | -- | Inwest Title Services Inc | |
| West Glen | -- | Guardian Title Company |
Source: Public Records
Mortgage History
| Date | Status | Borrower | Loan Amount |
|---|---|---|---|
| Open | Lucero Gabriel J | $121,600 | |
| Previous Owner | West Glen | $232,750 | |
| Previous Owner | West Glen | $134,900 |
Source: Public Records
Tax History
| Year | Tax Paid | Tax Assessment Tax Assessment Total Assessment is a certain percentage of the fair market value that is determined by local assessors to be the total taxable value of land and additions on the property. | Land | Improvement |
|---|---|---|---|---|
| 2025 | $2,617 | $238,150 | $119,649 | $118,501 |
| 2024 | $2,435 | $230,451 | $103,395 | $127,056 |
| 2023 | $2,424 | $417,000 | $193,512 | $223,488 |
| 2022 | $2,290 | $215,050 | $106,564 | $108,486 |
| 2021 | $2,111 | $303,000 | $139,320 | $163,680 |
| 2020 | $1,863 | $268,000 | $120,131 | $147,869 |
| 2019 | $1,924 | $271,000 | $134,760 | $136,240 |
| 2018 | $1,771 | $245,000 | $132,691 | $112,309 |
| 2016 | $1,486 | $111,100 | $52,919 | $58,181 |
| 2015 | $1,434 | $101,090 | $52,919 | $48,171 |
| 2014 | $1,511 | $110,153 | $52,919 | $57,234 |
| 2013 | -- | $94,738 | $40,825 | $53,913 |
Source: Public Records
Map
Nearby Homes
- 453 N 400 E Unit 7-D
- 513 N 400 E Unit 14B
- 17 E 400 N Unit 19B
- 49 E 200 N Unit 4
- 41 E 200 N Unit 6
- 55 E 200 N Unit 2
- 51 E 200 N Unit 3
- 256 N Main St
- 254 N Main St
- 252 N Main St
- 978 N 170 E
- 683 E 100 N
- 106 W 700 N
- 214 E 1250 N
- 320 N 200 W Unit 4
- 129 N 800 E
- 255 E 400 S
- 357 S 100 E
- 332 N 300 W
- 499 N 200 W Unit 30
Your Personal Tour Guide
Ask me questions while you tour the home.