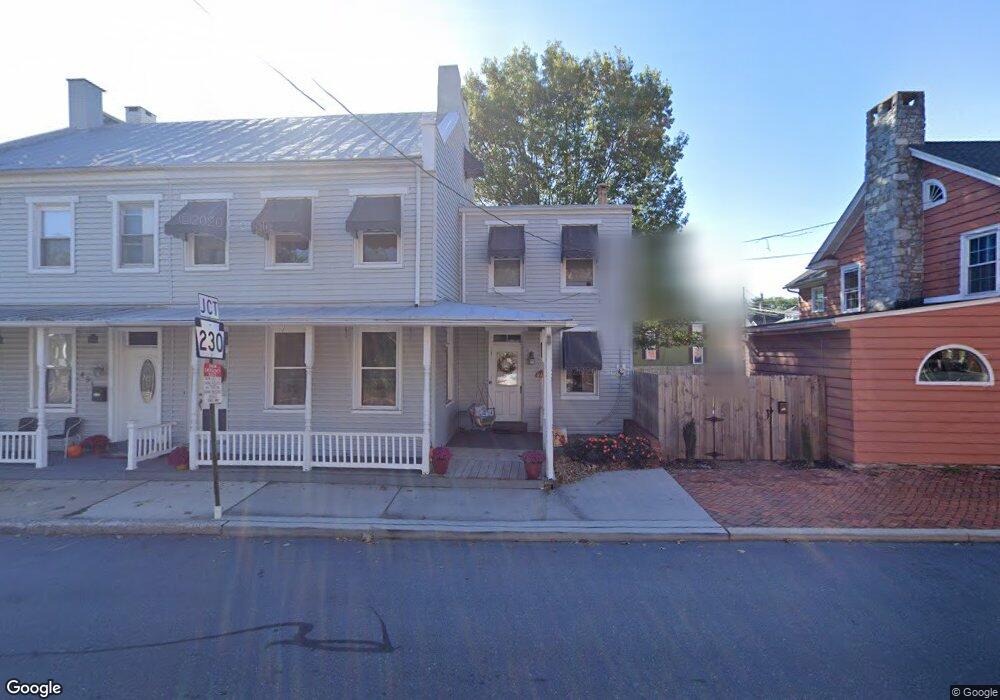
453 N Union St Middletown, PA 17057
Estimated Value: $174,000 - $197,000
4
Beds
1
Bath
2,162
Sq Ft
$87/Sq Ft
Est. Value
About This Home
This home is located at 453 N Union St, Middletown, PA 17057 and is currently estimated at $187,664, approximately $86 per square foot. 453 N Union St is a home located in Dauphin County with nearby schools including Middletown Area Middle School, Middletown Area High School, and Seven Sorrows of BVM School.
Ownership History
Date
Name
Owned For
Owner Type
Purchase Details
Closed on
Jan 3, 2024
Sold by
Kline Anthony and Kline Brianna
Bought by
Jones James T
Current Estimated Value
Purchase Details
Closed on
Jun 7, 2018
Sold by
Garcia Timothy William
Bought by
Reasner Retha A
Home Financials for this Owner
Home Financials are based on the most recent Mortgage that was taken out on this home.
Original Mortgage
$77,600
Interest Rate
4.5%
Mortgage Type
New Conventional
Create a Home Valuation Report for This Property
The Home Valuation Report is an in-depth analysis detailing your home's value as well as a comparison with similar homes in the area
Home Values in the Area
Average Home Value in this Area
Purchase History
| Date | Buyer | Sale Price | Title Company |
|---|---|---|---|
| Jones James T | $145,000 | None Listed On Document | |
| Reasner Retha A | $97,000 | None Available |
Source: Public Records
Mortgage History
| Date | Status | Borrower | Loan Amount |
|---|---|---|---|
| Previous Owner | Reasner Retha A | $77,600 |
Source: Public Records
Tax History Compared to Growth
Tax History
| Year | Tax Paid | Tax Assessment Tax Assessment Total Assessment is a certain percentage of the fair market value that is determined by local assessors to be the total taxable value of land and additions on the property. | Land | Improvement |
|---|---|---|---|---|
| 2025 | $3,480 | $78,500 | $14,800 | $63,700 |
| 2024 | $3,290 | $78,500 | $14,800 | $63,700 |
| 2023 | $3,236 | $78,500 | $14,800 | $63,700 |
| 2022 | $3,119 | $78,500 | $14,800 | $63,700 |
| 2021 | $2,989 | $78,500 | $14,800 | $63,700 |
| 2020 | $2,920 | $78,500 | $14,800 | $63,700 |
| 2019 | $2,878 | $78,500 | $14,800 | $63,700 |
| 2018 | $2,721 | $78,500 | $14,800 | $63,700 |
| 2017 | $2,721 | $78,500 | $14,800 | $63,700 |
| 2016 | $0 | $78,500 | $14,800 | $63,700 |
| 2015 | -- | $78,500 | $14,800 | $63,700 |
| 2014 | -- | $78,500 | $14,800 | $63,700 |
Source: Public Records
Map
Nearby Homes
- 33 E Main St
- 328 N Spring St
- 255 N Spring St
- 120 W Water St
- 333 & 335 N Catherine St
- 105 Oak Hill Dr
- 348 Oak Hill Dr
- 54 Nissley St
- 327 Oak Hill Dr
- 101 Juniper St
- 239 Wilson St
- 0 Wilson St Unit PADA2047564
- 0 Wilson St Unit L321 PADA2046888
- 376 Plane St
- 242 E Emaus St
- 908 Vine St
- 166 Ann St
- 219 S Union St
- 416 & 418 S Lawrence St
- 195 Magnolia Dr