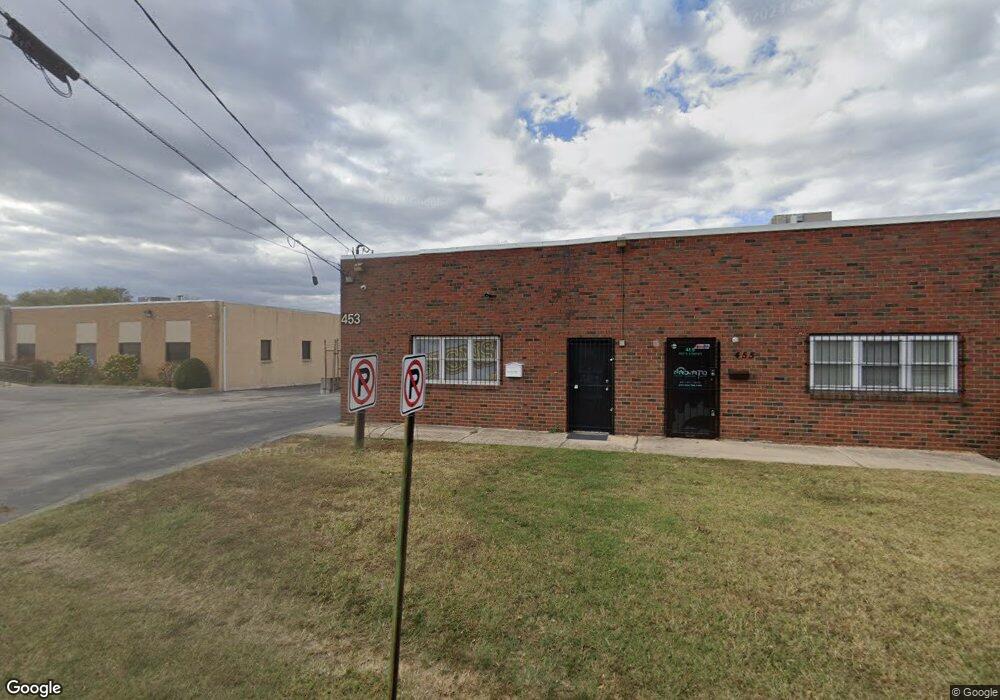
453 Penn St Lansdowne, PA 19050
Estimated Value: $467,878
--
Bed
--
Bath
4,705
Sq Ft
$99/Sq Ft
Est. Value
About This Home
This home is located at 453 Penn St, Lansdowne, PA 19050 and is currently estimated at $467,878, approximately $99 per square foot. 453 Penn St is a home located in Delaware County with nearby schools including Penn Wood Middle School, Penn Wood High School - Cypress Street Campus, and KIPP West Philadelphia Preparatory Chart.
Ownership History
Date
Name
Owned For
Owner Type
Purchase Details
Closed on
Jan 11, 2023
Sold by
Eminent Frontier Llc
Bought by
Hyun 19422 Llc
Current Estimated Value
Purchase Details
Closed on
Dec 21, 2016
Sold by
Dn Associates
Bought by
Eminent Frontier Llc
Home Financials for this Owner
Home Financials are based on the most recent Mortgage that was taken out on this home.
Original Mortgage
$320,000
Interest Rate
3.94%
Mortgage Type
Future Advance Clause Open End Mortgage
Purchase Details
Closed on
Oct 30, 1997
Sold by
D N Supply Corp
Bought by
Dn Associates
Home Financials for this Owner
Home Financials are based on the most recent Mortgage that was taken out on this home.
Original Mortgage
$195,000
Interest Rate
7.19%
Mortgage Type
Purchase Money Mortgage
Create a Home Valuation Report for This Property
The Home Valuation Report is an in-depth analysis detailing your home's value as well as a comparison with similar homes in the area
Home Values in the Area
Average Home Value in this Area
Purchase History
| Date | Buyer | Sale Price | Title Company |
|---|---|---|---|
| Hyun 19422 Llc | $400,000 | None Listed On Document | |
| Eminent Frontier Llc | $207,765 | None Available | |
| Dn Associates | $37,000 | -- |
Source: Public Records
Mortgage History
| Date | Status | Borrower | Loan Amount |
|---|---|---|---|
| Previous Owner | Eminent Frontier Llc | $320,000 | |
| Previous Owner | Dn Associates | $195,000 |
Source: Public Records
Tax History Compared to Growth
Tax History
| Year | Tax Paid | Tax Assessment Tax Assessment Total Assessment is a certain percentage of the fair market value that is determined by local assessors to be the total taxable value of land and additions on the property. | Land | Improvement |
|---|---|---|---|---|
| 2025 | $9,934 | $232,650 | $104,700 | $127,950 |
| 2024 | $9,934 | $232,650 | $104,700 | $127,950 |
| 2023 | $9,022 | $232,650 | $104,700 | $127,950 |
| 2022 | $8,603 | $232,650 | $104,700 | $127,950 |
| 2021 | $13,010 | $232,650 | $104,700 | $127,950 |
| 2020 | $6,131 | $98,170 | $40,220 | $57,950 |
| 2019 | $6,023 | $98,170 | $40,220 | $57,950 |
| 2018 | $5,939 | $98,170 | $0 | $0 |
| 2017 | $5,815 | $98,170 | $0 | $0 |
| 2016 | $539 | $98,170 | $0 | $0 |
| 2015 | $539 | $98,170 | $0 | $0 |
| 2014 | $539 | $98,170 | $0 | $0 |
Source: Public Records
Map
Nearby Homes
- 530 Orchard Ave
- 68 S Union Ave
- 545 Brookside Ave
- 435 Bonsall Ave
- 192 Fairview Ave
- 401 Hazel Ave
- 503 Bonsall Ave
- 537 Orchard Ave
- 407 Church Ln
- 522 S Union Ave
- 116 Bartram Ave
- 103 Lincoln Ave
- 137 Elder Ave
- 417 Holly Rd
- 144 Fairview Ave
- 608 Pembroke Ave
- 711 Pembroke Ave
- 93 N Union Ave
- 51 Nyack Ave
- 702 Cedar Ave
- 457 Penn St
- 451 Penn St
- 456 Penn St
- 611 Industrial Park Dr
- 300 N Front St Unit E21
- 300 N Front St Unit E31
- 000 N Front St
- lot N Front St
- TBD Cherry Ln
- 300 N Front St Unit E32
- 123 Burns Ave
- 550 Penn St
- 599 Penn St
- 622 Industrial Park Dr
- 438 Brookside Ave
- 601 Penn St
- 600 Penn St
- 602 Penn St
- 414 Industrial Park Dr
- 605 Penn St