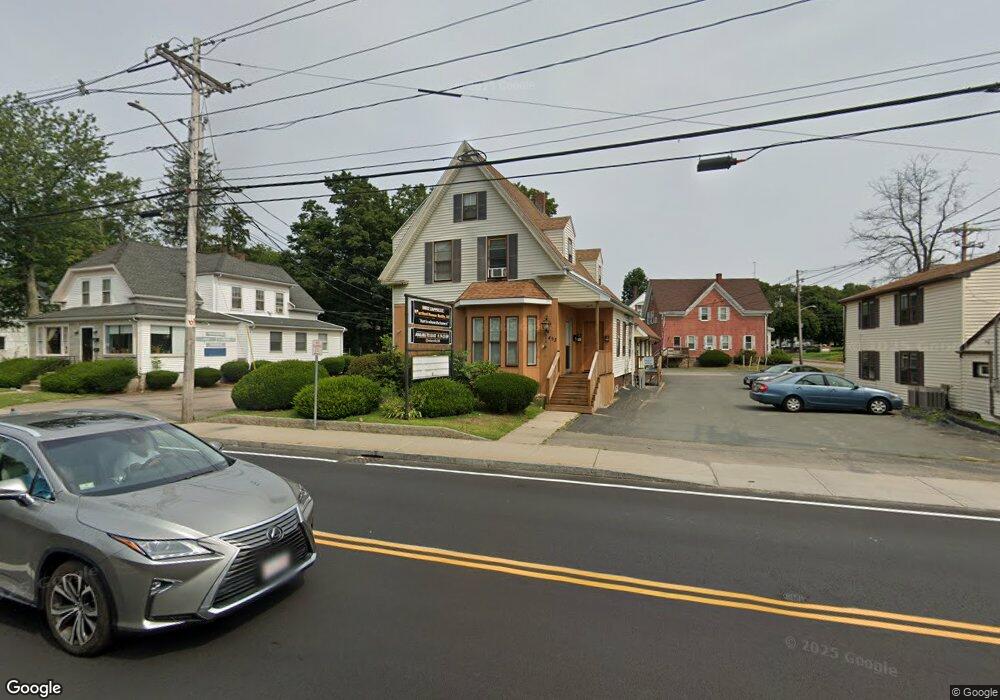
453 Pleasant St Brockton, MA 02301
Estimated Value: $778,023
1
Bed
3
Baths
1,200
Sq Ft
$648/Sq Ft
Est. Value
About This Home
This home is located at 453 Pleasant St, Brockton, MA 02301 and is currently estimated at $778,023, approximately $648 per square foot. 453 Pleasant St is a home located in Plymouth County with nearby schools including Louis F Angelo Elementary School, Raymond K-8 Elementary School, and Hancock Elementary School.
Ownership History
Date
Name
Owned For
Owner Type
Purchase Details
Closed on
Jan 16, 2003
Sold by
Middleton Frank
Bought by
Mass Com Rt
Current Estimated Value
Home Financials for this Owner
Home Financials are based on the most recent Mortgage that was taken out on this home.
Original Mortgage
$215,000
Outstanding Balance
$92,790
Interest Rate
6.18%
Mortgage Type
Commercial
Estimated Equity
$685,233
Purchase Details
Closed on
Jan 27, 2000
Sold by
Associates Home Equity
Bought by
Kimba Rt
Purchase Details
Closed on
Jan 29, 1999
Sold by
Brockton Cu
Bought by
Kimba Rt
Create a Home Valuation Report for This Property
The Home Valuation Report is an in-depth analysis detailing your home's value as well as a comparison with similar homes in the area
Home Values in the Area
Average Home Value in this Area
Purchase History
| Date | Buyer | Sale Price | Title Company |
|---|---|---|---|
| Mass Com Rt | $332,500 | -- | |
| Kimba Rt | $68,000 | -- | |
| Kimba Rt | $72,000 | -- |
Source: Public Records
Mortgage History
| Date | Status | Borrower | Loan Amount |
|---|---|---|---|
| Open | Kimba Rt | $130,810 | |
| Open | Kimba Rt | $215,000 | |
| Previous Owner | Kimba Rt | $186,000 | |
| Previous Owner | Kimba Rt | $260,000 |
Source: Public Records
Tax History Compared to Growth
Tax History
| Year | Tax Paid | Tax Assessment Tax Assessment Total Assessment is a certain percentage of the fair market value that is determined by local assessors to be the total taxable value of land and additions on the property. | Land | Improvement |
|---|---|---|---|---|
| 2025 | -- | $560,100 | $165,100 | $395,000 |
| 2024 | -- | $524,400 | $150,100 | $374,300 |
| 2023 | $0 | $465,800 | $128,100 | $337,700 |
| 2022 | $0 | $428,700 | $128,100 | $300,600 |
| 2021 | $0 | $405,100 | $122,000 | $283,100 |
| 2020 | $648 | $405,200 | $116,200 | $289,000 |
| 2019 | $0 | $350,200 | $116,200 | $234,000 |
| 2018 | $0 | $341,300 | $116,200 | $225,100 |
| 2017 | $0 | $314,300 | $116,200 | $198,100 |
| 2016 | -- | $294,100 | $116,220 | $177,880 |
| 2015 | -- | $294,100 | $116,220 | $177,880 |
| 2014 | -- | $294,100 | $116,220 | $177,880 |
Source: Public Records
Map
Nearby Homes
- 30 Malvern Rd
- 20 Montauk Rd
- 77 Colonel Bell Dr Unit 4
- 68 Cross St
- 45 Cross St
- 161 Moraine St
- 7 N Winnifred Rd
- 72 W Elm Terrace
- 194 Prospect St
- 0 Moraine St
- 34 Eaton St
- 10 Fitzpatrick Ave
- 32 Milton St
- 721 Pleasant St
- 126 Coventry Cir
- 96 Coventry Cir
- 72 Kurland Ave
- 15 Troy St
- 137 Boylston St
- 227 W Elm St Unit 3
- 453 Pleasant St Unit Suite 3
- 453 Pleasant St Unit Suite 2
- 453 Pleasant St Unit 2
- 457 Pleasant St
- 16 Belair St
- 449 Pleasant St
- 20 Belair St
- 000 Belair St
- 463 Pleasant St
- 26 Belair St
- 467 Pleasant St
- 450 Pleasant St Unit 5
- 408 Prospect St
- 34 Belair St
- 464 Pleasant St
- 7 Moraine St
- 7 Moraine St Unit 1
- 7 Moraine St Unit 2
- 11 Moraine St
- 15 Belair St Unit 11