NOT LISTED FOR SALE

453 S 6th St Unit 1 Auburn, IL 62615

Estimated Value: $151,000 - $182,000

3 Beds
1 Bath
1,295 Sq Ft
$127/Sq Ft Est. Value

Last Sold May 08, 2017

Last sale price $116,900 $90 Per Sq Ft

Est. 41% increase in value since last sale

Current estimated payment $1,079/month

Highlights

  • Deck
  • Ranch Style House
  • Fenced Yard

About This Home

As of May 2017

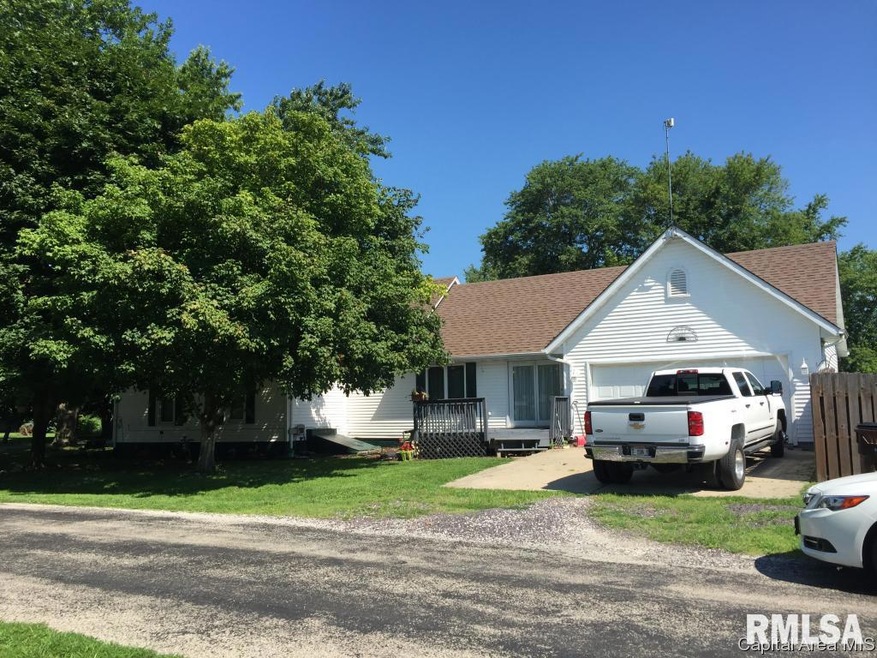
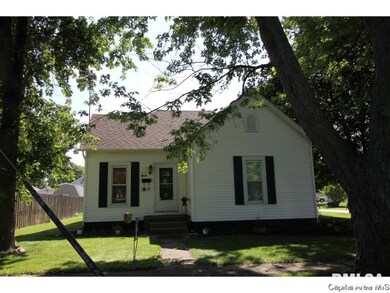
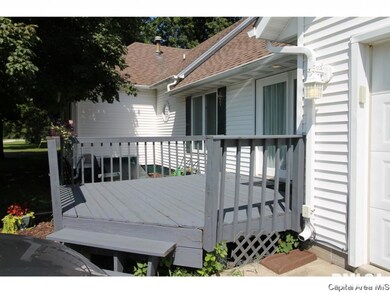
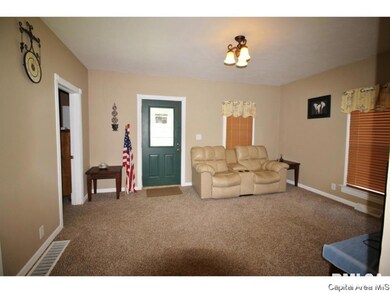
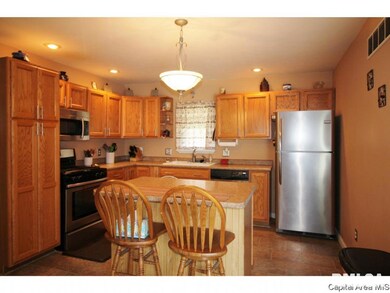
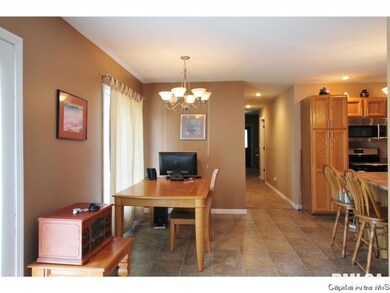
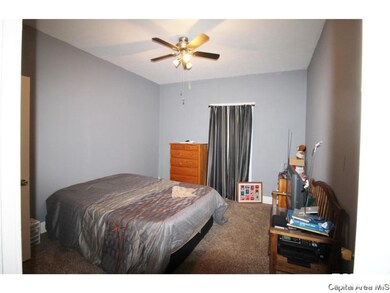
Wonderful home on the south side of Auburn. Quiet neighborhood. 3 Bedrooms 1.5 baths. All kitchen stainless appliances stay plus washer & dryer. Brand new kitchen tile backsplash. New carpet and vinyl flooring. Freshly painted in neutrals colors. Storage Shed stays. Privacy fenced backyard.

Last Agent to Sell the Property

Cheryl Dambacher

IN BETWEEN OFFICES License #471006537 Listed on: 03/08/2017

Last Buyer's Agent

Denise Perry

IN BETWEEN OFFICES License #475161914

Home Details

Home Type

  • Single Family

Est. Annual Taxes

  • $1,536

Lot Details

  • 9,017

Home Design

  • Ranch Style House

Kitchen

  • Oven or Range
  • Microwave
  • Dishwasher

Laundry

  • Dryer
  • Washer

Parking

  • Garage
  • Garage Door Opener

Additional Features

  • 1 Full Bathroom
  • Deck
  • Fenced Yard
  • Cable TV Available

Home Details

Home Type

Single Family

Est. Annual Taxes

$1,536

Lot Details

0

Listing Details

  • Class: Residential
  • Type: Single Family
  • Style: Ranch
  • Unit Style: 1-Level
  • Legal Description: SHUMWAYS ADDN. W 1/2 S 60' L 4
  • Special Features: None
  • Property Sub Type: Detached

Interior Features

  • Appliances: Dryer, Dishwasher, Microwave Oven, Refrigerator, Range/Oven, Washer
  • Interior Amenities: Cable Tv Available, Garage Door Opener(s)
  • Total Bathrooms: 2
  • Total Full Baths: 1
  • Total Half Baths: 1
  • Bedrooms: 3
  • Master Bedroom: Dimensions: 13.4x13.3, On Level: Main, Flooring: Carpet
  • Basement Foundation: Block, Brick
  • Bedroom 2: Dimensions: 13.4x11.5, On Level: Main, Flooring: Carpet
  • Bedroom 3: Dimensions: 10.7x9.5, On Level: Main, Flooring: Carpet
  • Den: Dimensions: 10.5x11.5, On Level: Main, Flooring: Vinyl
  • Formal Dining Room: Dimensions: 11x9.8, On Level: Main, Flooring: Vinyl
  • Kitchen: Dimensions: 12.6x10.6, On Level: Main, Flooring: Vinyl
  • Kitchen Dining: Island
  • Laundry: On Level: Main
  • Living Room: Dimensions: 13.3x15.7, On Level: Main, Flooring: Carpet
  • Price Per Sq Ft: 90.27
  • Finished Sq Ft: 1295
  • Total Sq Ft: 1295
  • Finished Main Level Sq Ft: 1295

Exterior Features

  • Exterior: Vinyl Siding
  • Exterior Amenities: Deck, Fenced Yard

Garage/Parking

  • Garage Parking: Attached, Gravel
  • Number Cars: 2

Utilities

  • Heating Cooling: Gas, Forced Air, Central Air
  • Water Sewer: Public Water, Public Sewer
  • Utility Companies: Cityville,Ameren Illinois

Schools

  • High School: Auburn District #10

Lot Info

  • Estimated Lot Size: 60X150
  • Lot Description: Corner, Level
  • Geo Subdivision: IL

Tax Info

  • Annual Taxes: 1536
  • Parcel Id Number Tax Id: 34100403009
  • Tax Exemptions: Homestead Improvement, Senior Homestead
  • Tax Year: 2015

MLS Schools

  • High School School District: Auburn District #10

Ownership History

Date Name Owned For Owner Type

Purchase Details

Closed on
Jul 10, 2006
Current Estimated Value
$164,414

Purchase Details

Closed on
Nov 28, 2005

Purchase Details

Closed on
Feb 11, 2000

Purchase Details

Closed on
Jun 9, 1995
Source: Public Records

Range of Values:

Collateral Analytics

Collateral Analytics Collateral Analytics AVMs (Automated Valuation Model) employ a number of statistical approaches combined with neighborhood-specific comparable selection guarantees the most up-to-date and precise valuations.

Not Available

Collateral Analytics does not have data for the current month. Please view the chart for historical values.

ICE

ICE Mortgage Technology ICE Mortgage Technology’s AVM (Automated Valuation Model) is a state-of-the-art online residential property valuation tool that provides a quick and accurate estimate of the value of almost any home in the U.S.

Not Available

ICE Mortgage Technology does not have data for the current month. Please view the chart for historical values.

First American

First American First American Data & Analytics’ next-generation AVM combines unrivaled data assets with a blended ensemble of valuation models to produce highly accurate, reliable valuations you can trust.

Not Available

First American does not have data for the current month. Please view the chart for historical values.

Quantarium

Quantarium Quantarium’s valuation service, repeatedly proven the industry’s most accurate and comprehensive, is supercharged with a self-learning and auto-tuning AI engine that continually becomes smarter and more accurate as it processes daily inputs from the industry’s leading RE data lake.

Not Available

Quantarium does not have data for the current month. Please view the chart for historical values.

Average Value
Not Available
List Price
Sold Price
Create a Home Valuation Report for This Property
The Home Valuation Report is an in-depth analysis detailing your home's value as well as a comparison with similar homes in the area

Home Values in the Area

Source: Public Records

Average Home Value in this Area


Source: Public Records

Purchase History

Date Buyer Sale Price Title Company
-- $105,000 --
-- $97,500 --
-- $83,000 --
-- $35,400 --
Source: Public Records

Property History

Date Event Price List to Sale Price per Sq Ft
05/08/2017 05/08/17 Sold $116,900 -2.5% $90 / Sq Ft
03/14/2017 03/14/17 Pending -- -- --
03/08/2017 03/08/17 For Sale $119,900 -- $93 / Sq Ft
Source: RMLS Alliance

Tax History Compared to Growth

Source: Public Records

Tax History

Year Tax Paid Tax Assessment Tax Assessment Total Assessment is a certain percentage of the fair market value that is determined by local assessors to be the total taxable value of land and additions on the property. Land Improvement
2024 $2,504 $49,161 $6,048 $43,113
2023 $2,392 $44,958 $5,531 $39,427
2022 $2,222 $42,566 $5,237 $37,329
2021 $2,152 $40,877 $5,029 $35,848
2020 $2,149 $40,734 $5,011 $35,723
2019 $2,096 $39,725 $4,887 $34,838
2018 $2,052 $38,904 $4,786 $34,118
2017 $1,719 $37,462 $4,609 $32,853
2016 $1,522 $37,227 $4,580 $32,647
2015 $1,536 $36,793 $4,527 $32,266
2014 $1,547 $37,364 $4,597 $32,767
2013 $1,685 $36,136 $4,446 $31,690
Source: Public Records

Agents Affiliated with this Home

  • Section Image
  • Section Image
See All Agents

Map

Source: RMLS Alliance

MLS Number: RMACA171353

RMLS Alliance

APN: 34-10.0-403-009