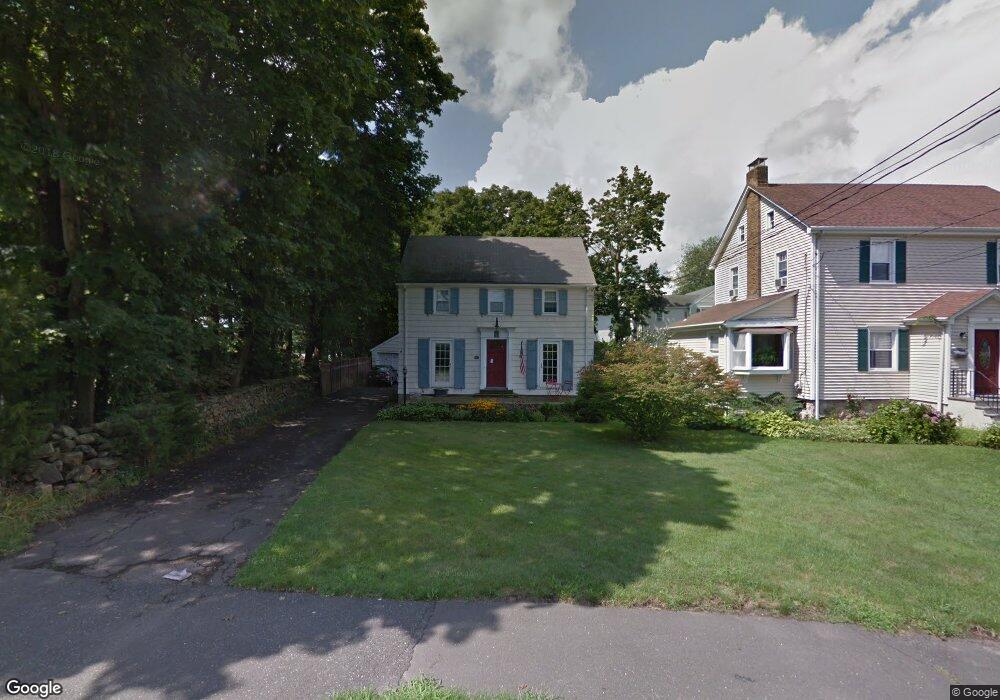
453 South Ave New Canaan, CT 06840
Estimated Value: $1,458,000 - $1,713,943
4
Beds
3
Baths
2,072
Sq Ft
$765/Sq Ft
Est. Value
About This Home
This home is located at 453 South Ave, New Canaan, CT 06840 and is currently estimated at $1,585,736, approximately $765 per square foot. 453 South Ave is a home located in Fairfield County with nearby schools including South Elementary School, Saxe Middle School, and New Canaan High School.
Ownership History
Date
Name
Owned For
Owner Type
Purchase Details
Closed on
Nov 23, 1999
Sold by
Hughes Paul M and Hughes Maureen M
Bought by
Engel John A and Engel Susan C
Current Estimated Value
Purchase Details
Closed on
Dec 2, 1994
Sold by
Engel John A and Engel Melissa H
Bought by
Robustelli Christopher and Robustelli Bridget K
Purchase Details
Closed on
Mar 15, 1993
Sold by
Adam Sydney
Bought by
Engel John and Engel Melissa
Create a Home Valuation Report for This Property
The Home Valuation Report is an in-depth analysis detailing your home's value as well as a comparison with similar homes in the area
Home Values in the Area
Average Home Value in this Area
Purchase History
| Date | Buyer | Sale Price | Title Company |
|---|---|---|---|
| Engel John A | $525,525 | -- | |
| Robustelli Christopher | $290,000 | -- | |
| Engel John | $230,000 | -- |
Source: Public Records
Mortgage History
| Date | Status | Borrower | Loan Amount |
|---|---|---|---|
| Open | Engel John | $350,000 | |
| Closed | Engel John | $300,000 | |
| Closed | Engel John | $155,000 |
Source: Public Records
Tax History Compared to Growth
Tax History
| Year | Tax Paid | Tax Assessment Tax Assessment Total Assessment is a certain percentage of the fair market value that is determined by local assessors to be the total taxable value of land and additions on the property. | Land | Improvement |
|---|---|---|---|---|
| 2025 | $17,957 | $1,075,900 | $871,500 | $204,400 |
| 2024 | $17,365 | $1,075,900 | $871,500 | $204,400 |
| 2023 | $13,714 | $724,080 | $666,820 | $57,260 |
| 2022 | $13,301 | $724,080 | $666,820 | $57,260 |
| 2021 | $13,149 | $724,080 | $666,820 | $57,260 |
| 2020 | $13,149 | $724,080 | $666,820 | $57,260 |
| 2019 | $13,207 | $724,080 | $666,820 | $57,260 |
| 2018 | $13,198 | $749,560 | $565,950 | $183,610 |
| 2017 | $12,959 | $749,560 | $565,950 | $183,610 |
| 2016 | $12,665 | $749,560 | $565,950 | $183,610 |
| 2015 | $12,414 | $749,560 | $565,950 | $183,610 |
| 2014 | $12,069 | $749,560 | $565,950 | $183,610 |
Source: Public Records
Map
Nearby Homes
- 25 Gower Rd
- 354 South Ave
- 52 Putnam Rd
- 44 Putnam Rd
- 31 Selleck Place
- 317 Park St
- 50 Harrison Ave
- 216 White Oak Shade Rd
- 12 Lincoln Dr
- 202 Weed St
- 197 Park St Unit 13
- 184 Marvin Ridge Rd
- 180 Summer St
- 234 Marvin Ridge Rd
- 15 Burtis Ave Unit Townhome D
- 15 Burtis Ave Unit West Penthouse B
- 15 Burtis Ave Unit East Penthouse C
- 15 Burtis Ave Unit Townhome A
- 15 Burtis Ave Unit East Plaza 203
- 64 East Ave